
1h Novice

How Do We Know Where an Earthquake Originated?
A tremendous number of earthquakes occur every year around the world. The primary tool seismologists use to locate the source of each quake is a network of seismometers. Seismometers are instruments designed to be sensitive enough to feel even the smallest motion of the waves coming from distant locations on Earth. By understanding how seismic waves travel these records of ground motion, called seismograms, can be interpreted to enable us to locate the earthquake’s source.
In this activity, students use recent 3-component seismograms (recordings of motion on the N/S, E/W, and up/down axis) to locate quakes. Students identify P and S waves in their seismograms and measure the time between arrival of the P and S wave. Students then use this time to look-up the distance the epicenter is away from the station using the travel-time-curve. By combining their information with the results from at least three other students using seismograms recorded at different locations, the location of the epicenter can be determined.
While seismologists have not used this method of locating quakes since the advent of computers, it is an excellent exercise to get students familiar with the information contained within seismograms and excited about earthquakes as part of the Earth system.
By the end of this activity, the student will be able to:
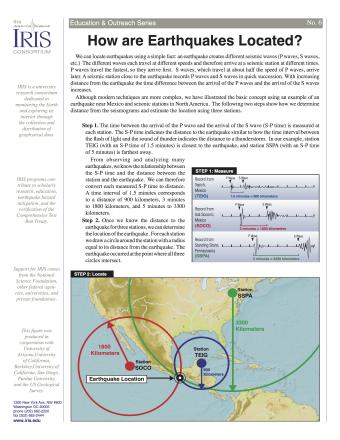
Knowing precisely where an earthquake occurred is an important piece of scientific information. It can help seismologists identify and map seismic hazards. It is also a fundamental piece of information necessary for facilitating studies of Earth's internal structures. This fact sheet provides an overview of the S-P process to locate an earthquake.
NOTE: Out of stock; self-printing only.
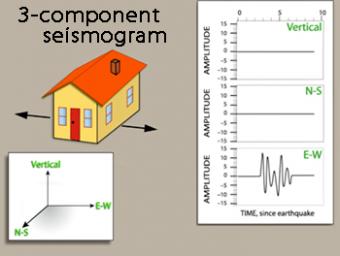
We use exaggerated motion of a building (seismic station) to show how the ground moves during an earthquake, and why it is important to measure seismic waves using 3 components: vertical, N-S, and E-W. Before showing an actual distant earthquake, we break down the three axes of movement to clarify the 3 seismograms.
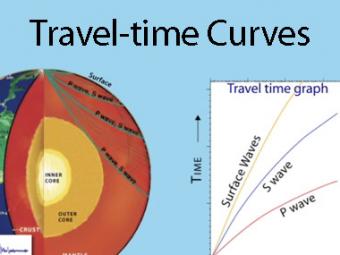
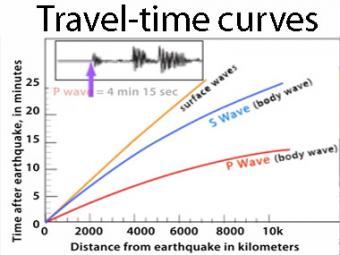
A travel time curve is a graph of the time that it takes for seismic waves to travel from the epicenter of an earthquake to the hundreds of seismograph stations around the world. The arrival times of P, S, and surface waves are shown to be predictable. This animates an IRIS poster linked with the animation.
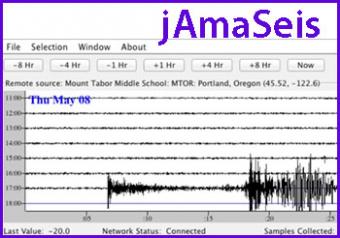
jAmaSeis is a free, java-based program that allows users to obtain and display seismic data in real-time from either a local instrument or from remote stations.
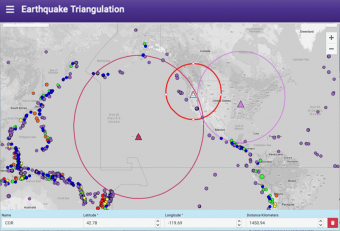
Easily plot stations and distance circles on an interactive world map to demonstrate how earthquakes can be located using the time difference in the arrivals of P and S waves at a set of seismic stations.
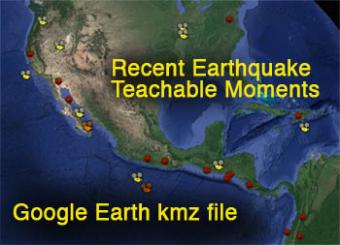
The Incorporated Research Institutions for Seismology has plotted over 100 Recent Earthquake Teachable Moment presentations into Google Earth, available as a .kml file that is updated whenever a new RETM is released by IRIS. These teachable moments are rapid-response presentations for educators following worldwide earthquakes of greater than magnitude 7.0, and newsworthy smaller earthquakes.
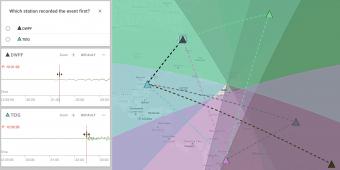
EqLocate is a suite of interactive apps giving users the opportunity to choose their preferred earthquake location method and specific earthquake they want to analyze. Through these easy-to-use tools, learners explore real data from recent and historic seismic events gaining valuable hands-on experience in earthquake locating techniques.
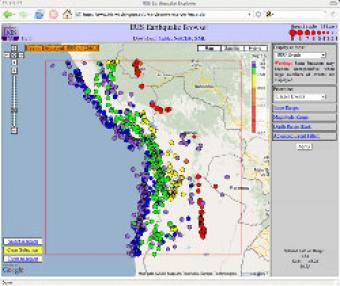
The IRIS Earthquake Browser (IEB) is an interactive tool for exploring millions of seismic event epicenters (normally earthquakes) on a map of the world. Selections of up to 5000 events can also be viewed in 3D and freely rotated with the 3D Viewer companion tool.
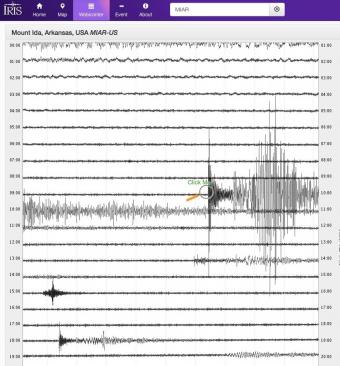
Explore earthquakes near you or from around the globe using the new IRIS Station Monitor app! Select from hundreds of seismic stations throughout the world. View up-to-the-minute recorded ground motions or see recordings from previous days and past events. Get information about recent events and choose to annotate wave arrivals.
The arrival times of P and S waves are used to determine the distance to an earthquake using standard travel-time curves.
We encourage the reuse and dissemination of the material on this site as long as attribution is retained. To this end the material on this site, unless otherwise noted, is offered under Creative Commons Attribution (CC BY 4.0) license
