
Novice
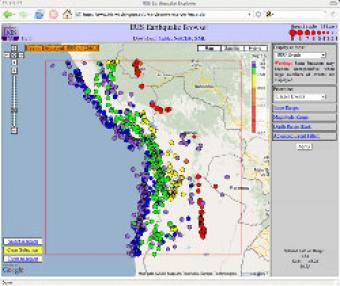
The video on the right is a tutorial on how to use the IRIS Earthquake Browser. The IEB is an interactive tool for exploring millions of seismic event epicenters (normally earthquakes) on a map of the world. Visitors can query the database of millions of events based on earthquake magnitude, depth, timing, and location. Results are displayed on a two-dimensional map-view where the user can toggle features like plate tectonic boundaries, terrain or satellite mapping, and zoom to make the map as informative and as visualizing appealing as possible. Selections of up to 5000 events can also be viewed in profile and freely rotated with the built in 3D viewer. No plugins (like Flash or Java) are required. Notably the query, with (almost) all of its settings, can be bookmarked, emailed and socially shared. The data can also be viewed as a sortable table or exported as a csv file for analysis in software like Excel, R, etc. IEB is very easy to use and has value both educationally and for some scientific research-related purposes.
Click the "Open Resource" button to the right to go directly to the app!
While IEB was initially develop by a software engineer at the IRIS Data Management Center, it has been refined and tailored by the EPO program to make more useful by an educational audience. Such refinements were also aimed at incorporate some of the functionality from the Seismic Eruption software developed by Alan Jones into a web-based tool. The original Seismic Eruption software is still available and can be downloaded for Windows-based PC environments (Download .exe file).
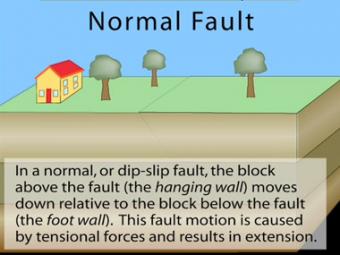
In a normal fault, the block above the fault moves down relative to the block below the fault. This fault motion is caused by extensional forces and results in extension. Other names: normal-slip fault, tensional fault or gravity fault. Examples: Sierra Nevada/Owens Valley; Basin & Range faults.
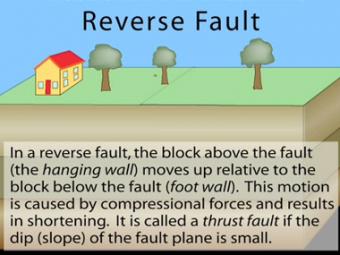
In a reverse fault, the block above the fault moves up relative to the block below the fault. This fault motion is caused by compressional forces and results in shortening. A reverse fault is called a thrust fault if the dip of the fault plane is small. Other names: thrust fault, reverse-slip fault or compressional fault]. Examples: Rocky Mountains, Himalayas.
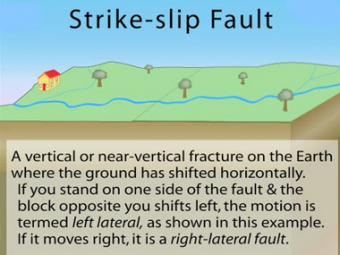
In a strike-slip fault, the movement of blocks along a fault is horizontal. The fault motion of a strike-slip fault is caused by shearing forces. Other names: transcurrent fault, lateral fault, tear fault or wrench fault. Examples: San Andreas Fault, California; Anatolian Fault, Turkey.
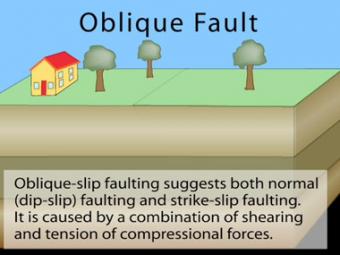
This left-lateral oblique-slip fault suggests both normal faulting and strike-slip faulting. It is caused by a combination of shearing and tensional forces. Nearly all faults will have some component of both dip-slip (normal or reverse) and strike-slip, so defining a fault as oblique requires both dip and strike components to be measurable and significant.
A transform fault is a type of strike-slip fault wherein the relative horizontal slip is accommodating the movement between two ocean ridges or other tectonic boundaries. They are connected on both ends to other faults.
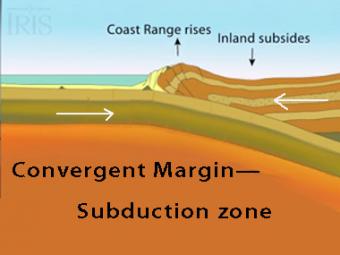
The subduction zone iswhere two tectonic (lithospheric) plates come together, one subducting (diving) beneath the other. The plates are locked together and periodically overcome the friction causing the leading edge of the overlying plate to surge back, lifting a wall of water producting a tsunami.
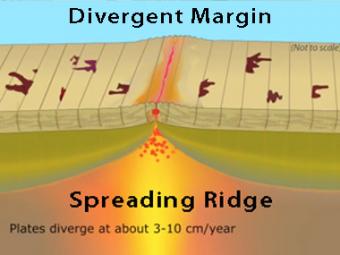
New oceanic crust is created at this boundary when basalt magma, formed in the mantle, rises into fractures in the crust and solidifies. Spreading ridges are high elevation because the young oceanic plate at the ridge crest is hot and less dense than the older, colder and more dense plate on the flanks of the ridge.
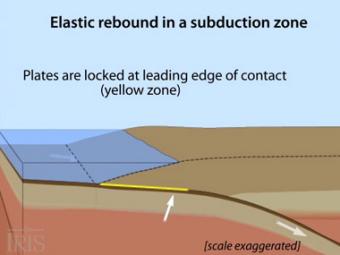
Oblique view of a highly generalized animation of a subduction zone where an oceanic plate is subducting beneath a continental plate. (See sketch below for parts.) This scenario can happen repeatedly on a 100-500 year cycle. The process which produces a mega-thrust earthquake would generate a tsunami, not depicted here.
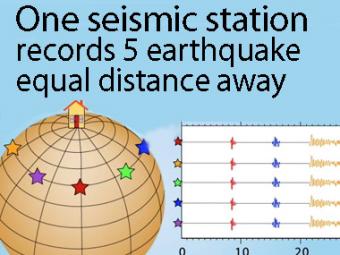
A gridded sphere is used to show a single station recording five equidistant earthquakes.
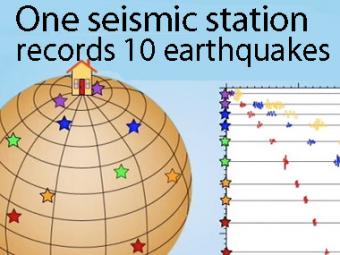
A gridded sphere is used to show:
1) the seismic stations don't need to be lined up longitudinally to create travel-time curves,
as they appear in the first animation, and
2) a single station records widely separated earthquakes that plot on the travel-time curves.
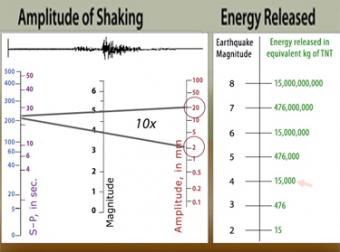
The "moment magnitude" scale has replaced the Richter scale for large earthquakes. Scientists have developed far-more sensitive seismometers that, with faster computers, have enabled them to record & interpret a broader spectrum of seismic signals than was possible in the 1930's, when the Richter magnitude was developed. Find out what scientists learn from seismograms.
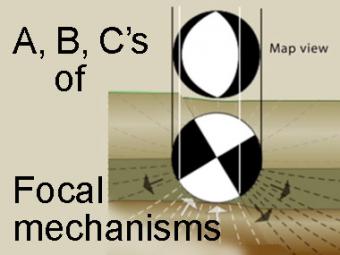
The focal mechanism of an earthquake is represented by a “beachball” diagram. These are released after an earthquake to illustrate the type of faulting produced the earthquake. This difficult concept is carefully explained using strike-slip, normal, and thrust faults.
GIFS for select segments included as optional download.
The arrival times of P and S waves are used to determine the distance to an earthquake using standard travel-time curves.
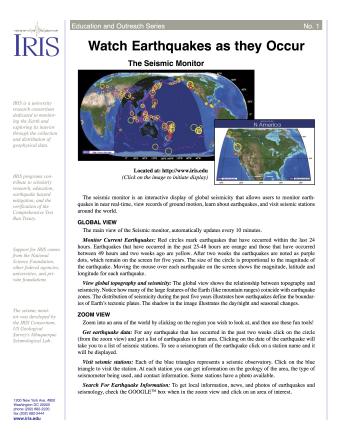
Keep tabs on current seismicity with IRIS's Seismic Monitor. This fact sheet provides an introduction to an interactive display of global seismicity that allows users to monitor earthquakes in near real-time, view records of ground motion, learn about earthquakes, and visit seismic stations around the world.
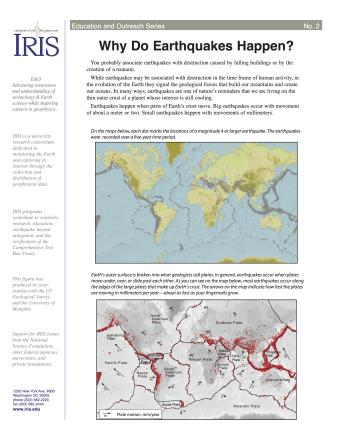
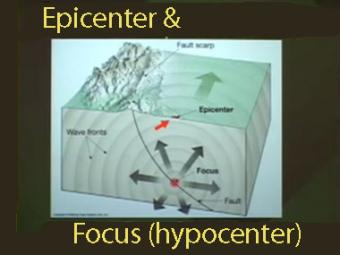
Many people associate earthquakes with destruction caused by falling buildings or by the creation of a tsunami. While earthquakes may be associated with destruction in the time frame of human activity, in the evolution of the Earth they signal the geological forces that build our mountains and create our oceans. This fact sheet provides an introduction to the causes of earthquakes.
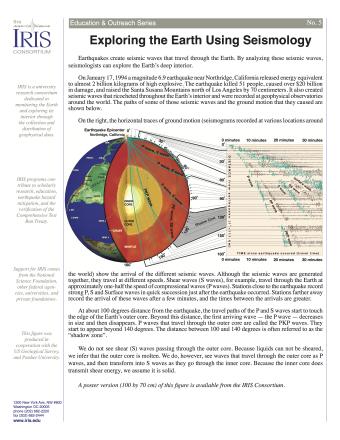
Earthquakes create seismic waves that travel through the Earth. By analyzing these seismic waves, seismologists can explore the Earth's deep interior. This fact sheet uses data from the 1994 magnitude 6.9 earthquake near Northridge, California to illustrate both this process and Earth's interior structure.
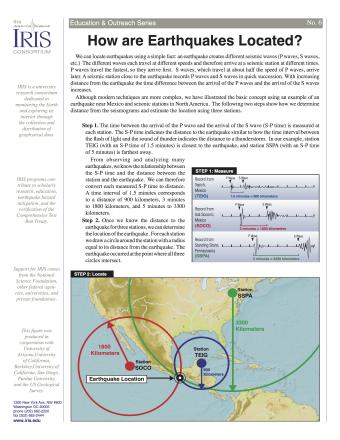
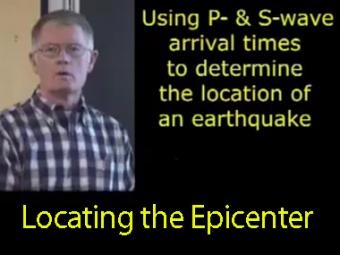
Knowing precisely where an earthquake occurred is an important piece of scientific information. It can help seismologists identify and map seismic hazards. It is also a fundamental piece of information necessary for facilitating studies of Earth's internal structures. This fact sheet provides an overview of the S-P process to locate an earthquake.
NOTE: Out of stock; self-printing only.
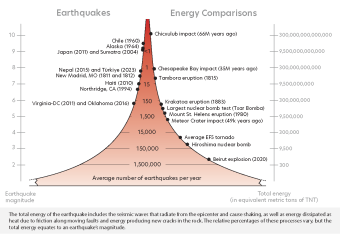
Earth is an active place and earthquakes are always happening somewhere. In fact, the National Earthquake Information Center locates about 12,000-14,000 earthquakes each year! This fact sheet illustrates information on the frequency of earthquakes of various magnitudes, along with details on the effects of earthquakes and the equivalent energy release.
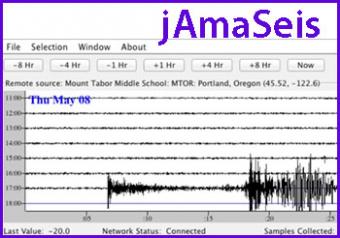
jAmaSeis is a free, java-based program that allows users to obtain and display seismic data in real-time from either a local instrument or from remote stations.
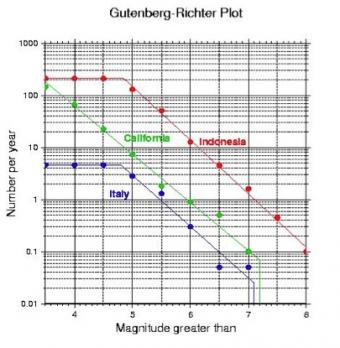
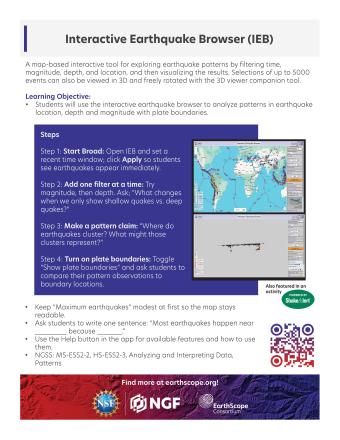
This activity allows the students to select a global region of interest and to interrogate the earthquake catalog to obtain quantitative data on the rate of occurrence of earthquakes of various magnitudes within their chosen region. Products lead to discussions of earthquake prediction and forcasting.
In this exercise, students will learn about the various types of plate boundaries, investigate well-known examples of some of these boundaries, and then apply what they have learned to East Africa to determine the most likely cause of seismicity in this area of the world.
We encourage the reuse and dissemination of the material on this site as long as attribution is retained. To this end the material on this site, unless otherwise noted, is offered under Creative Commons Attribution (CC BY 4.0) license
