
Novice
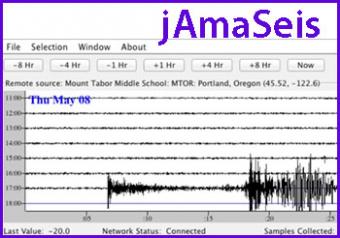
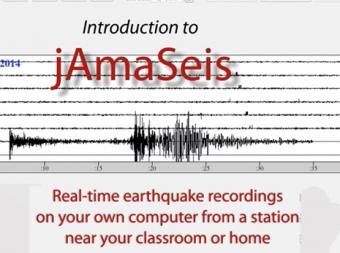
jAmaSeis facilitates the study of seismological concepts in middle school through introductory undergraduate classrooms. Users can obtain and display seismic data in real-time from either a local instrument or from remote stations. Users can also filter data, fit a seismogram to travel time curves, triangulate event epicenters on a globe, estimate event magnitudes, and generate images showing seismograms and corresponding calculations. Users accomplish these tasks through an interface designed specifically for educational use.
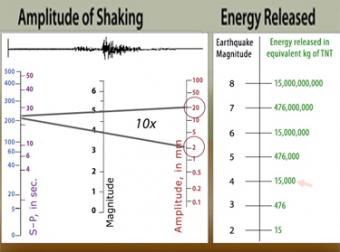
The "moment magnitude" scale has replaced the Richter scale for large earthquakes. Scientists have developed far-more sensitive seismometers that, with faster computers, have enabled them to record & interpret a broader spectrum of seismic signals than was possible in the 1930's, when the Richter magnitude was developed. Find out what scientists learn from seismograms.
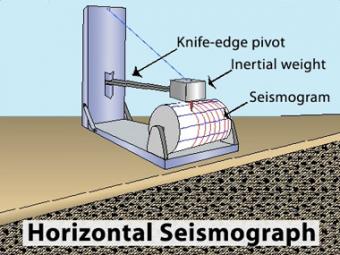
Animation of the principles of a drum-style horizontal seismograph station that records back- and-forth (N-S, E-W) movement.
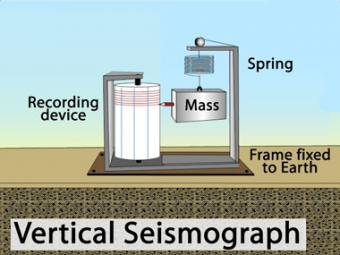
Animation of the principles of a drum-style vertical seismograph station that records up-and-down movement.
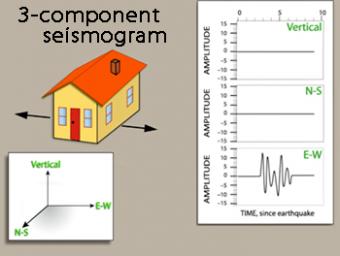
We use exaggerated motion of a building (seismic station) to show how the ground moves during an earthquake, and why it is important to measure seismic waves using 3 components: vertical, N-S, and E-W. Before showing an actual distant earthquake, we break down the three axes of movement to clarify the 3 seismograms.
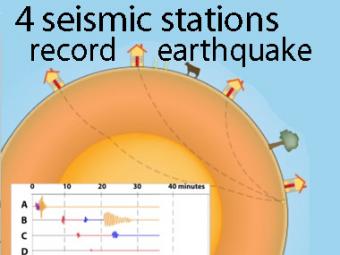
A cow and a tree in this narrated cartoon for fun and to emphasize that seismic waves traveling away from an earthquake occur everywhere, not just at seismic stations A, B, C, and D. A person would feel a large earthquake only at station A near the epicenter. Stations B, C, D, and the cow are too far from the earthquake to feel the seismic waves though sensitive equipment records their arrival.
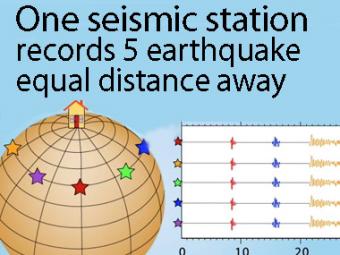
A gridded sphere is used to show a single station recording five equidistant earthquakes.
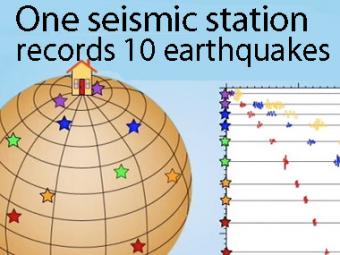
A gridded sphere is used to show:
1) the seismic stations don't need to be lined up longitudinally to create travel-time curves,
as they appear in the first animation, and
2) a single station records widely separated earthquakes that plot on the travel-time curves.
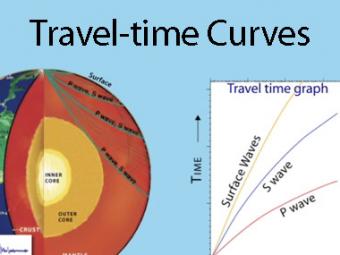
A travel time curve is a graph of the time that it takes for seismic waves to travel from the epicenter of an earthquake to the hundreds of seismograph stations around the world. The arrival times of P, S, and surface waves are shown to be predictable. This animates an IRIS poster linked with the animation.
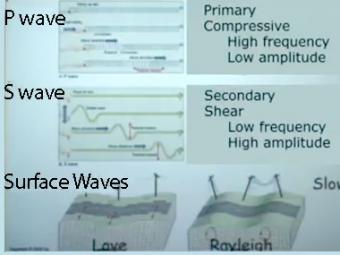
Video lecture on wave propagation and speeds of three fundamental kinds of seismic waves.
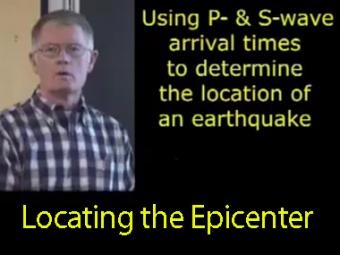
The arrival times of P and S waves are used to determine the distance to an earthquake using standard travel-time curves.
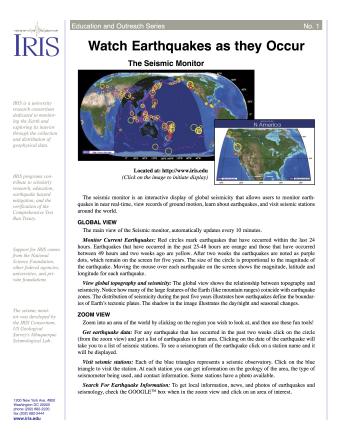
Keep tabs on current seismicity with IRIS's Seismic Monitor. This fact sheet provides an introduction to an interactive display of global seismicity that allows users to monitor earthquakes in near real-time, view records of ground motion, learn about earthquakes, and visit seismic stations around the world.
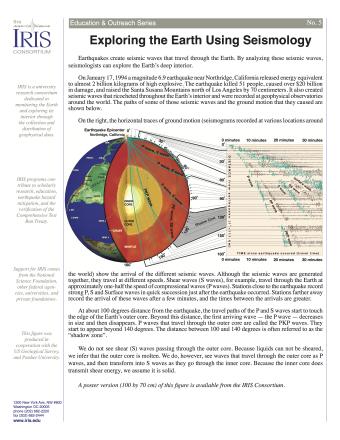
Earthquakes create seismic waves that travel through the Earth. By analyzing these seismic waves, seismologists can explore the Earth's deep interior. This fact sheet uses data from the 1994 magnitude 6.9 earthquake near Northridge, California to illustrate both this process and Earth's interior structure.
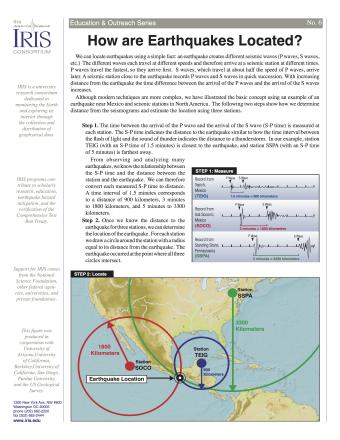
Knowing precisely where an earthquake occurred is an important piece of scientific information. It can help seismologists identify and map seismic hazards. It is also a fundamental piece of information necessary for facilitating studies of Earth's internal structures. This fact sheet provides an overview of the S-P process to locate an earthquake.
NOTE: Out of stock; self-printing only.
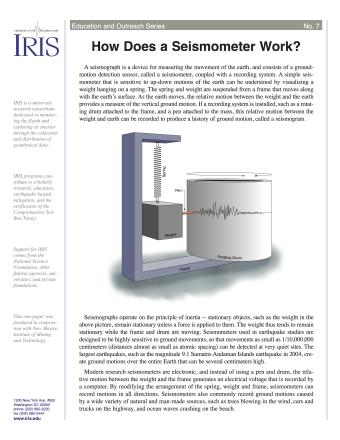
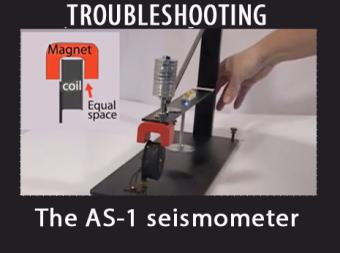
A seismograph is a device for measuring the movement of the earth, and consists of a ground-motion detection sensor, called a seismometer, coupled with a recording system. This fact sheet provides an overview of the basic components of a seismometer and physical science principles behind its operation.
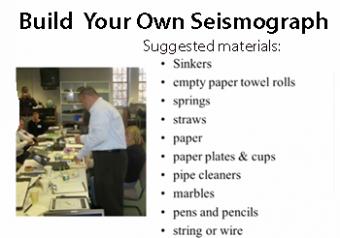
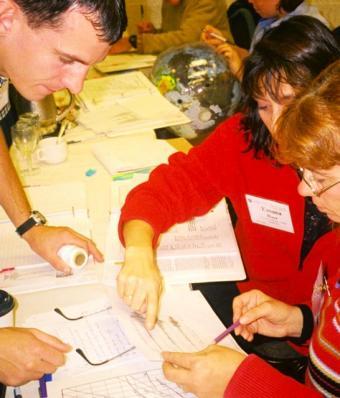
Working in small groups of 3-4, students design and construct a seismograph using common household and craft materials provided. Students will demonstrate to the class (by shaking their table) how their seismographs records ground motion and if possible, the time of the disturbance occured.
To understand plate tectonic processes and hazards, and to better understand where future earthquakes are likely to occur, it is important to locate earthquakes as they occur. In this activity students use three-component seismic data from recent earthquakes to locate a global earthquake.
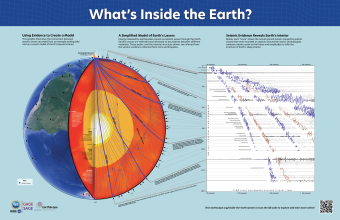
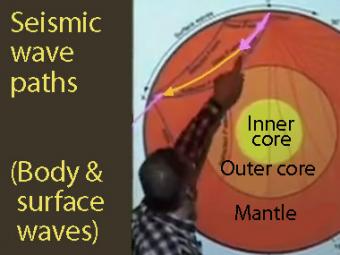
Seismic waves from earthquakes ricochet throughout Earth's interior and are recorded at geophysical observatories around the world. The paths of some of those seismic waves and the ground motion that they caused are used by seismologists to illuminate Earth's deep interior.
We encourage the reuse and dissemination of the material on this site as long as attribution is retained. To this end the material on this site, unless otherwise noted, is offered under Creative Commons Attribution (CC BY 4.0) license
