
Novice
NOTE: This software is no longer supported. IRIS has created a replacement application that offers seismograms worldwide for significant earthquakes.
These two applications are:
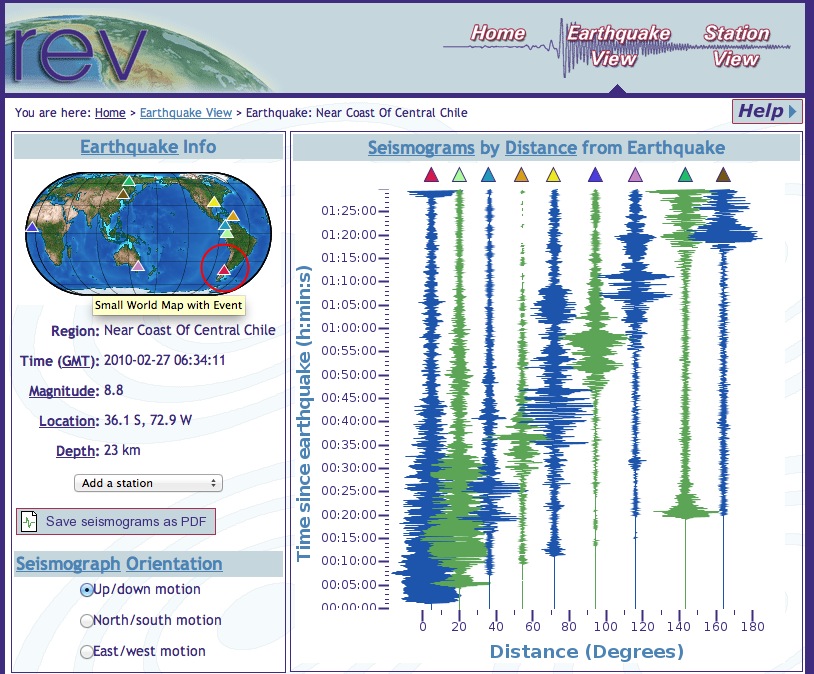
Students work first in small groups, and then as a whole class to compare predicted seismic wave travel times, generated by students from a scaled Earth model, to observed seismic data from a recent earthquakes. This activity uses models, real data and emphasizes the process of science.
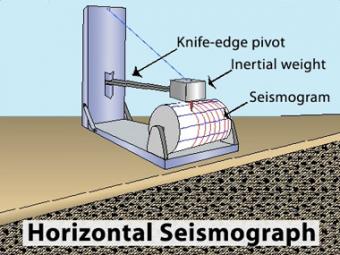
Animation of the principles of a drum-style horizontal seismograph station that records back- and-forth (N-S, E-W) movement.
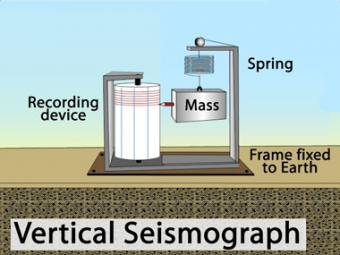
Animation of the principles of a drum-style vertical seismograph station that records up-and-down movement.
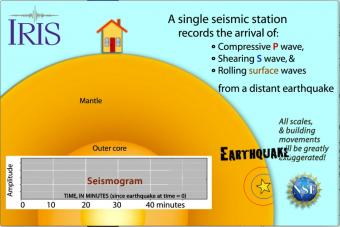
Seismic waves travel through the earth to a single seismic station. Scale and movement of the seismic station are greatly exaggerated to depict the relative motion recorded by the seismogram as P, S, and surface waves arrive.
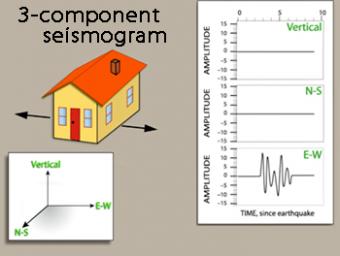
We use exaggerated motion of a building (seismic station) to show how the ground moves during an earthquake, and why it is important to measure seismic waves using 3 components: vertical, N-S, and E-W. Before showing an actual distant earthquake, we break down the three axes of movement to clarify the 3 seismograms.
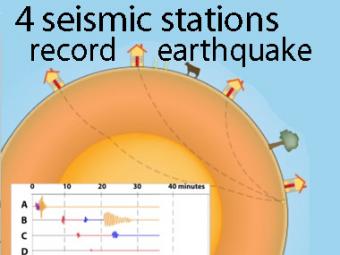
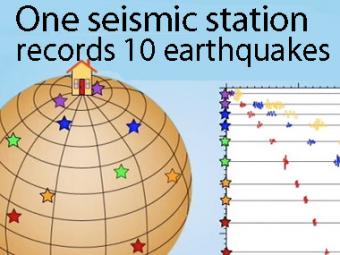
A cow and a tree in this narrated cartoon for fun and to emphasize that seismic waves traveling away from an earthquake occur everywhere, not just at seismic stations A, B, C, and D. A person would feel a large earthquake only at station A near the epicenter. Stations B, C, D, and the cow are too far from the earthquake to feel the seismic waves though sensitive equipment records their arrival.
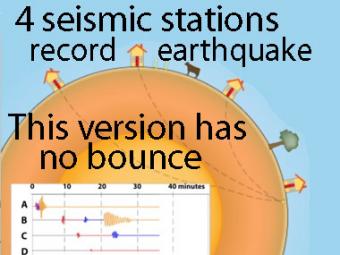
This companion to the animation "Four-Station Seismograph network" shows the arrival of seismic waves through select wave paths through the Earth (P and S waves) and over the surface of the Earth. The movement at distant stations occurs at a microscopic scale. While that doesn't result in noticeable movements of the buildings, the arrivals are recorded on sensitive seismometers.
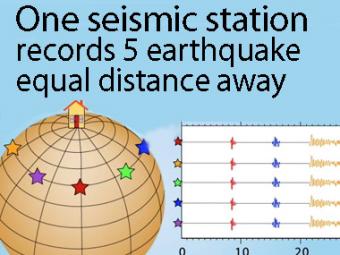
A gridded sphere is used to show a single station recording five equidistant earthquakes.
A gridded sphere is used to show:
1) the seismic stations don't need to be lined up longitudinally to create travel-time curves,
as they appear in the first animation, and
2) a single station records widely separated earthquakes that plot on the travel-time curves.
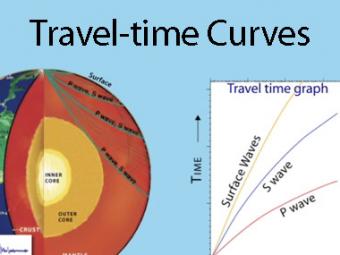
A travel time curve is a graph of the time that it takes for seismic waves to travel from the epicenter of an earthquake to the hundreds of seismograph stations around the world. The arrival times of P, S, and surface waves are shown to be predictable. This animates an IRIS poster linked with the animation.
The "moment magnitude" scale has replaced the Richter scale for large earthquakes. Scientists have developed far-more sensitive seismometers that, with faster computers, have enabled them to record & interpret a broader spectrum of seismic signals than was possible in the 1930's, when the Richter magnitude was developed. Find out what scientists learn from seismograms.
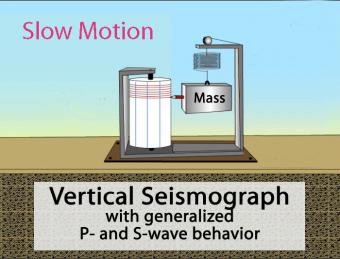
Animation of the principles of a drum-style vertical seismograph station that records up-and-down movement.
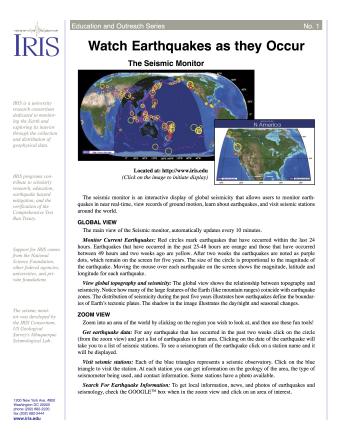
Keep tabs on current seismicity with IRIS's Seismic Monitor. This fact sheet provides an introduction to an interactive display of global seismicity that allows users to monitor earthquakes in near real-time, view records of ground motion, learn about earthquakes, and visit seismic stations around the world.
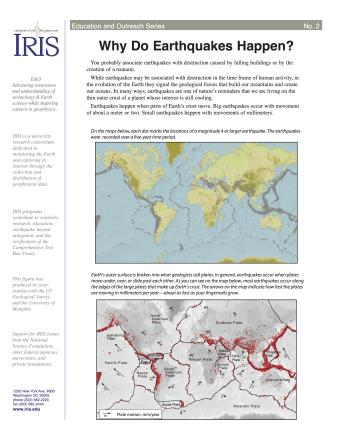
Many people associate earthquakes with destruction caused by falling buildings or by the creation of a tsunami. While earthquakes may be associated with destruction in the time frame of human activity, in the evolution of the Earth they signal the geological forces that build our mountains and create our oceans. This fact sheet provides an introduction to the causes of earthquakes.
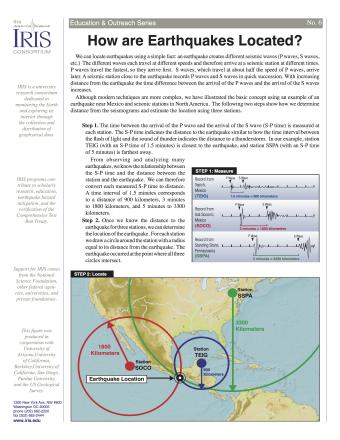
Knowing precisely where an earthquake occurred is an important piece of scientific information. It can help seismologists identify and map seismic hazards. It is also a fundamental piece of information necessary for facilitating studies of Earth's internal structures. This fact sheet provides an overview of the S-P process to locate an earthquake.
NOTE: Out of stock; self-printing only.
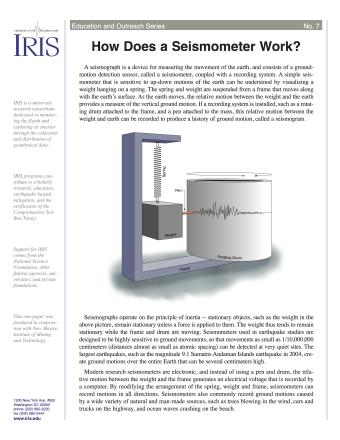
A seismograph is a device for measuring the movement of the earth, and consists of a ground-motion detection sensor, called a seismometer, coupled with a recording system. This fact sheet provides an overview of the basic components of a seismometer and physical science principles behind its operation.
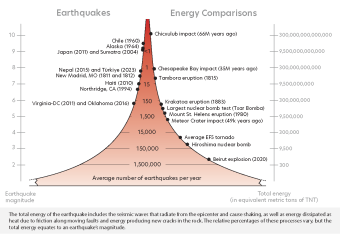
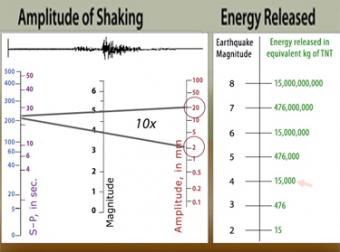
Earth is an active place and earthquakes are always happening somewhere. In fact, the National Earthquake Information Center locates about 12,000-14,000 earthquakes each year! This fact sheet illustrates information on the frequency of earthquakes of various magnitudes, along with details on the effects of earthquakes and the equivalent energy release.
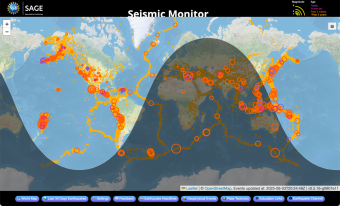
A beautiful map of the latest earthquakes in near-real time. The map also provides links to related resources, news, and connections to 3D maps.
jAmaSeis is a free, java-based program that allows users to obtain and display seismic data in real-time from either a local instrument or from remote stations.
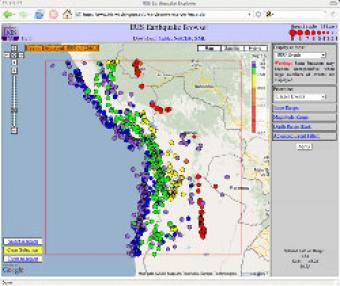
The IRIS Earthquake Browser (IEB) is an interactive tool for exploring millions of seismic event epicenters (normally earthquakes) on a map of the world. Selections of up to 5000 events can also be viewed in 3D and freely rotated with the 3D Viewer companion tool.
The IRIS Earthquake Browser (IEB) is an interactive tool for exploring millions of seismic event epicenters (normally earthquakes) on a map of the world. Selections of up to 5000 events can also be viewed in 3D and freely rotated with the 3D Viewer companion tool.
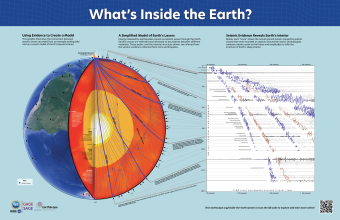
Seismic waves from earthquakes ricochet throughout Earth's interior and are recorded at geophysical observatories around the world. The paths of some of those seismic waves and the ground motion that they caused are used by seismologists to illuminate Earth's deep interior.
We encourage the reuse and dissemination of the material on this site as long as attribution is retained. To this end the material on this site, unless otherwise noted, is offered under Creative Commons Attribution (CC BY 4.0) license
