Novice
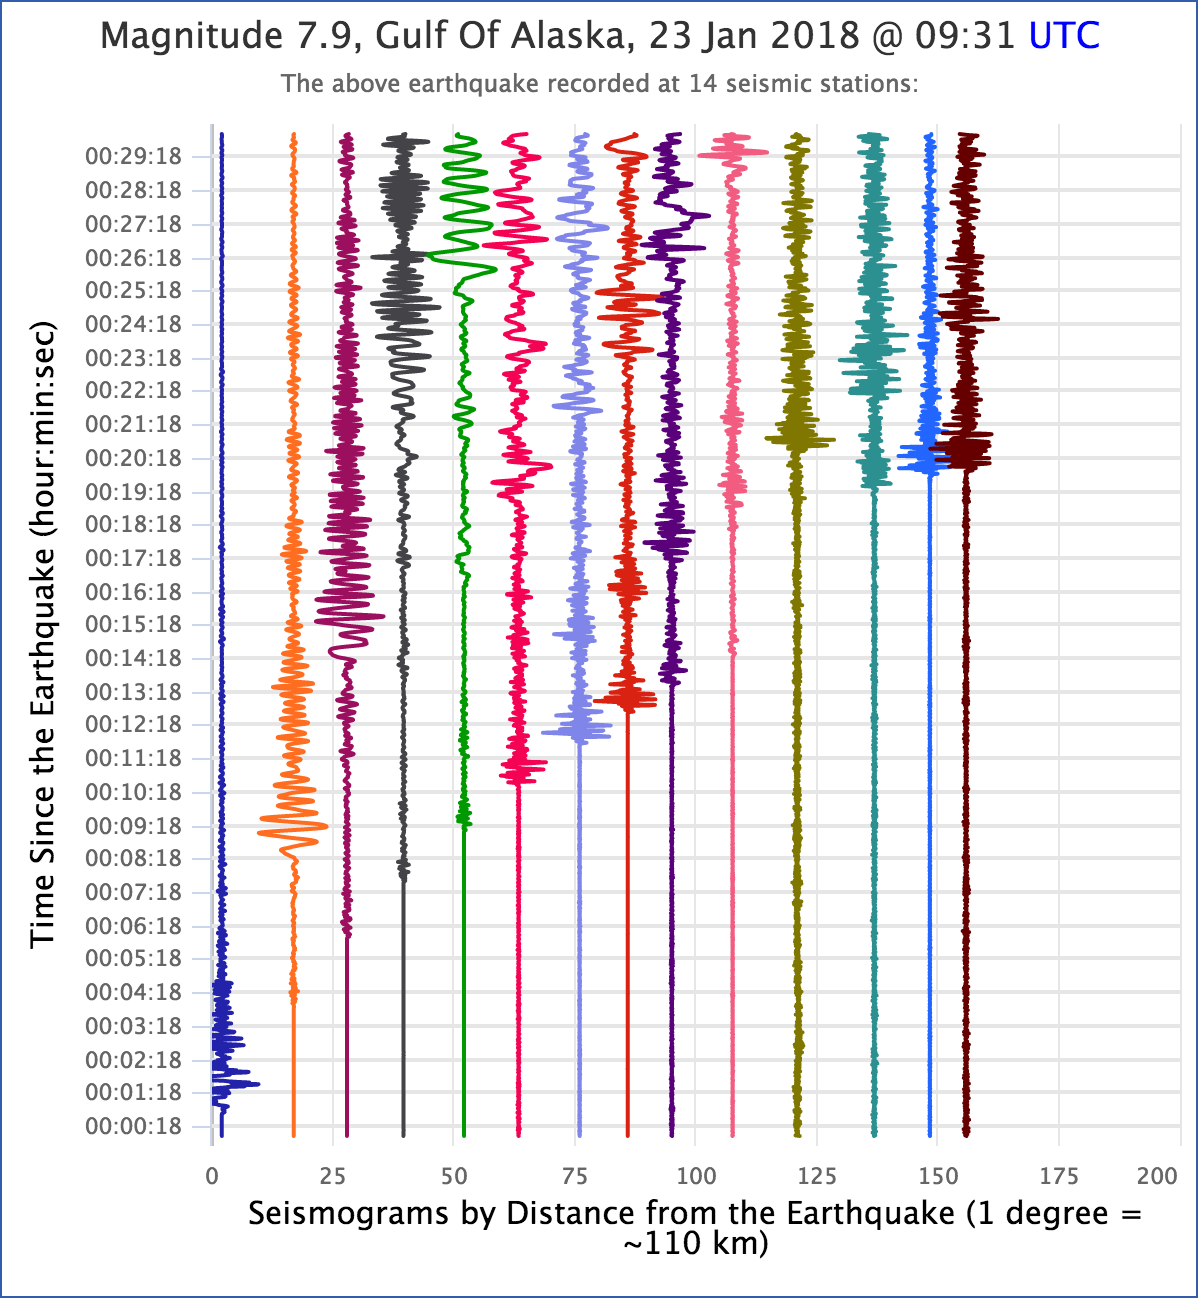
The Global Seismogram Viewer automatically creates clear plots of seismograms of large earthquakes from stations around the world, displayed by distance from the earthquake. The plots are tablet-friendly and can also be printed for use in a classroom without computers. The plots are designed to be appropriate for use with no parameters to set, but users can also modify the plots, such as including a recording station near a chosen location. A guided exercise is provided in the related resourrces tab (above), where students use the seismograms to discover the diameter of Earth’s outer core. Students can pick and compare phase arrival times onscreen which is key to performing the exercise. A companion station map shows station locations and further information and is linked to the seismogram plots.
Students work first in small groups, and then as a whole class to compare predicted seismic wave travel times, generated by students from a scaled Earth model, to observed seismic data from a recent earthquakes. This activity uses models, real data and emphasizes the process of science.

In this activity students will evalaute Silly Putty and Oobleck, both of which demonstrate proprieties of both solid and liquids, as a potential concrete model for Earth's Asthenosphere.
In this multi-step lab, students explore the concepts of seismic wave propagation through materials with different mechanical properties, and examine seismic evidence from a recent earthquake to infer Earth’s internal structure and composition. This lab is designed to be done with an instructor present to answer questions and guide students to conclusions
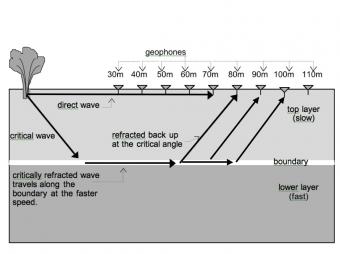
Like other waves, seismic waves obey the laws of physics. In this activity Physics students have the opportunity to apply their understanding of the basic concepts of waves (e.g. reflection, refraction and transmission of energy) as they examine seismic data to determine how far it is from the surface to the bedrock.
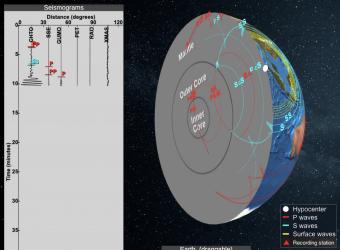
Seismic Waves is a browser-based tool to visualize the propagation of seismic waves from historic earthquakes through Earth’s interior and around its surface. Easy-to-use controls speed-up, slow-down, or reverse the wave propagation. By carefully examining these seismic wave fronts and their propagation, the Seismic Waves tool illustrates how earthquakes can provide evidence that allows us to infer Earth’s interior structure.
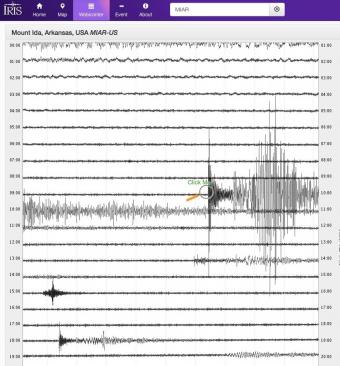
Explore earthquakes near you or from around the globe using the new IRIS Station Monitor app! Select from hundreds of seismic stations throughout the world. View up-to-the-minute recorded ground motions or see recordings from previous days and past events. Get information about recent events and choose to annotate wave arrivals.
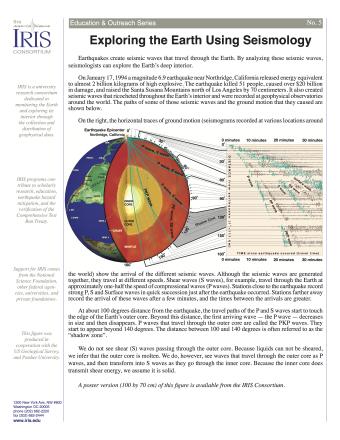
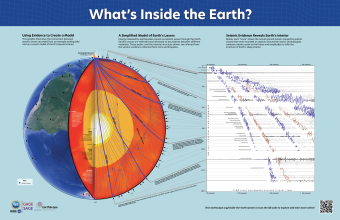
Earthquakes create seismic waves that travel through the Earth. By analyzing these seismic waves, seismologists can explore the Earth's deep interior. This fact sheet uses data from the 1994 magnitude 6.9 earthquake near Northridge, California to illustrate both this process and Earth's interior structure.
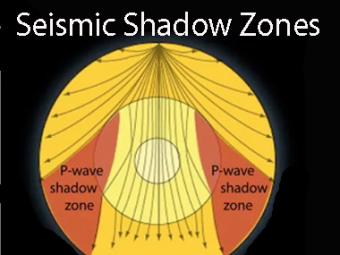
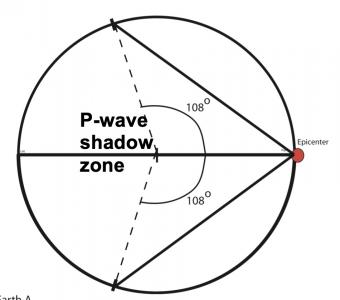
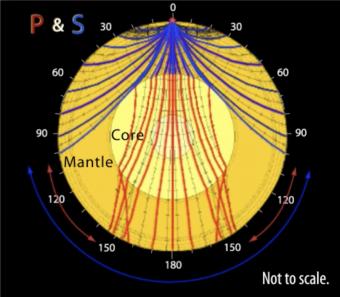
Seismic shadow zones have taught us much about the inside of the earth. This shows how P waves travel through solids and liquids, but S waves are stopped by the liquid outer core.
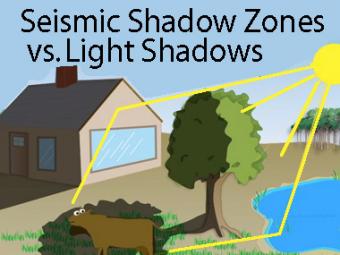
The wave properties of light are used as an analogy to help us understand seismic-wave behavior.
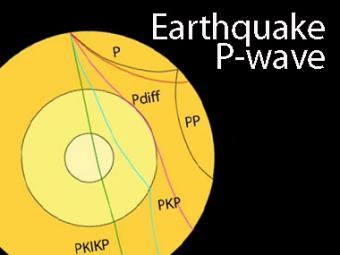
The shadow zone is the area of the earth from angular distances of 104 to 140 degrees from a given earthquake that does not receive any direct P waves. The different phases show how the initial P wave changes when encountering boundaries in the Earth.
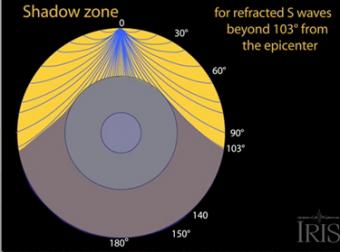
The shadow zone results from S waves being stopped entirely by the liquid core. Three different S-wave phases show how the initial S wave is stopped (damped), or how it changes when encountering boundaries in the Earth.
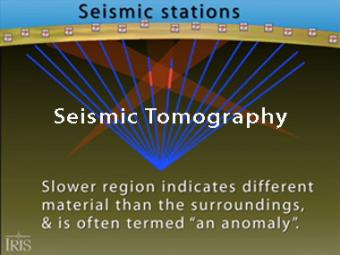
Seismic tomography is an imaging technique that uses seismic waves generated by earthquakes and explosions to create computer-generated, three-dimensional images of Earth's interior. CAT scans are often used as an analogy. Here we simplify things and make an Earth of uniform density with a slow zone that we image as a magma chamber.
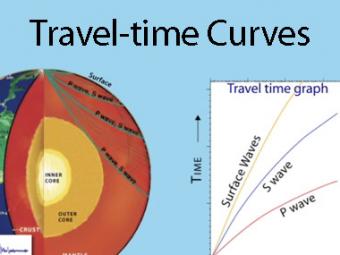
A travel time curve is a graph of the time that it takes for seismic waves to travel from the epicenter of an earthquake to the hundreds of seismograph stations around the world. The arrival times of P, S, and surface waves are shown to be predictable. This animates an IRIS poster linked with the animation.
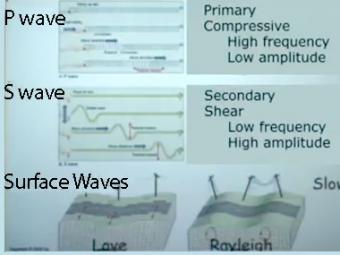
Video lecture on wave propagation and speeds of three fundamental kinds of seismic waves.
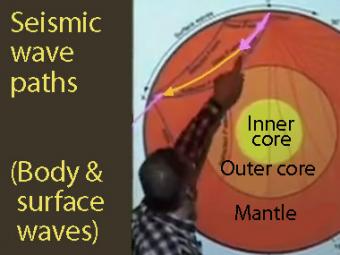
Seismic waves from earthquakes ricochet throughout Earth's interior and are recorded at geophysical observatories around the world. The paths of some of those seismic waves and the ground motion that they caused are used by seismologists to illuminate Earth's deep interior.
We encourage the reuse and dissemination of the material on this site as long as attribution is retained. To this end the material on this site, unless otherwise noted, is offered under Creative Commons Attribution (CC BY 4.0) license