
1min 6s Novice Spanish Spanish Spanish
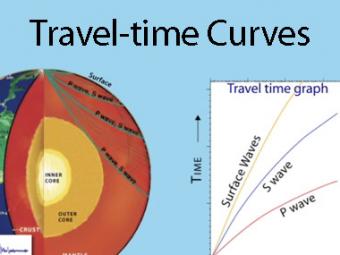
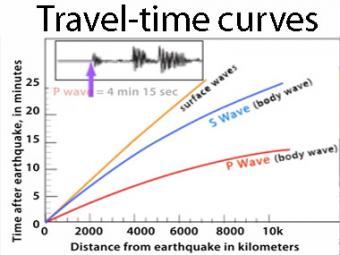
Where do travel-time graphs come from?
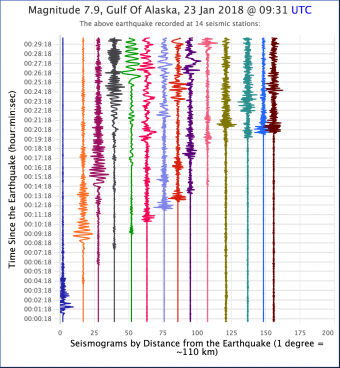
A travel time curve is a graph of the time that it takes for seismic waves to travel from the epicenter of an earthquake to seismograph stations at varying distances away. The velocity of seismic waves through different materials yield information about Earth's deep interior. IRIS' travel times graphic for the 1994 Northridge, CA earthquake (described in No.5. Exploring the Earth Using Seismology) is animated to show how travel times are determined. Seismic waves "bounce" the buildings to merely illustrate arrival times and wave behavior, not to depict reality. The resultant seismograms show that stations around the world record somewhat predictable arrival times.
CLOSED CAPTIONING: A .srt file is included with the download. Use an appropriate media player to utilize captioning.
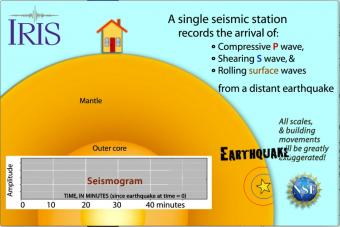
Seismic waves travel through the earth to a single seismic station. Scale and movement of the seismic station are greatly exaggerated to depict the relative motion recorded by the seismogram as P, S, and surface waves arrive.
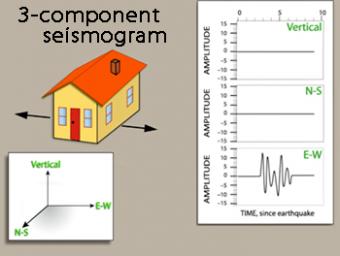
We use exaggerated motion of a building (seismic station) to show how the ground moves during an earthquake, and why it is important to measure seismic waves using 3 components: vertical, N-S, and E-W. Before showing an actual distant earthquake, we break down the three axes of movement to clarify the 3 seismograms.
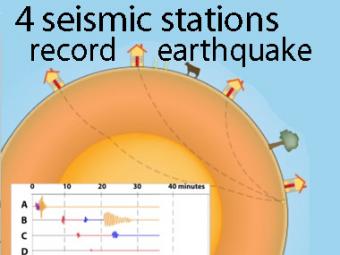
A cow and a tree in this narrated cartoon for fun and to emphasize that seismic waves traveling away from an earthquake occur everywhere, not just at seismic stations A, B, C, and D. A person would feel a large earthquake only at station A near the epicenter. Stations B, C, D, and the cow are too far from the earthquake to feel the seismic waves though sensitive equipment records their arrival.
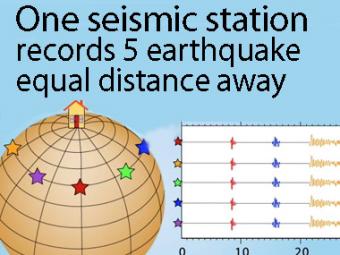
A gridded sphere is used to show a single station recording five equidistant earthquakes.
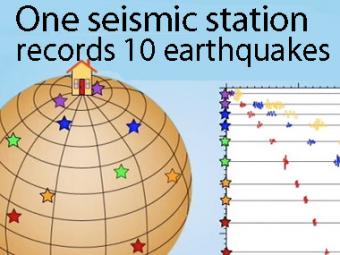
A gridded sphere is used to show:
1) the seismic stations don't need to be lined up longitudinally to create travel-time curves,
as they appear in the first animation, and
2) a single station records widely separated earthquakes that plot on the travel-time curves.
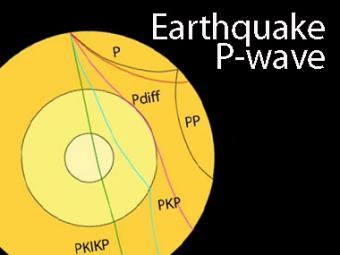
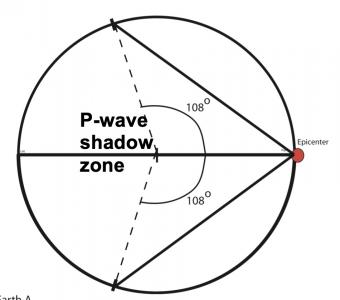
The shadow zone is the area of the earth from angular distances of 104 to 140 degrees from a given earthquake that does not receive any direct P waves. The different phases show how the initial P wave changes when encountering boundaries in the Earth.
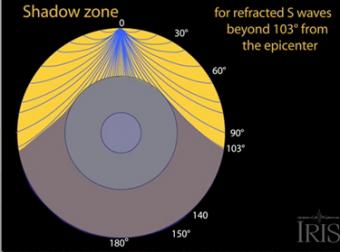
The shadow zone results from S waves being stopped entirely by the liquid core. Three different S-wave phases show how the initial S wave is stopped (damped), or how it changes when encountering boundaries in the Earth.
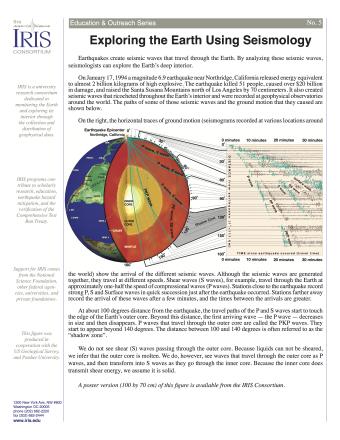
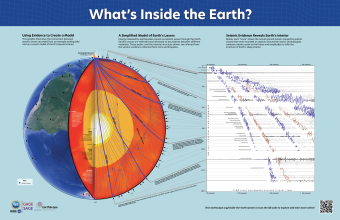
Earthquakes create seismic waves that travel through the Earth. By analyzing these seismic waves, seismologists can explore the Earth's deep interior. This fact sheet uses data from the 1994 magnitude 6.9 earthquake near Northridge, California to illustrate both this process and Earth's interior structure.
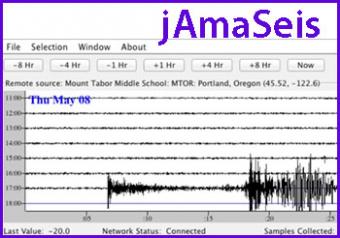
jAmaSeis is a free, java-based program that allows users to obtain and display seismic data in real-time from either a local instrument or from remote stations.
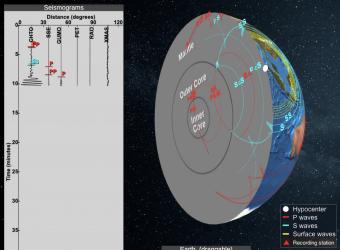
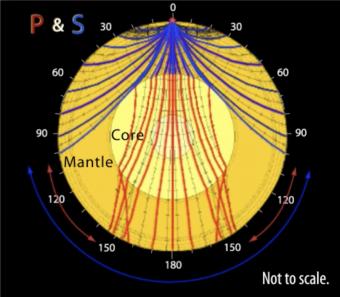
Seismic Waves is a browser-based tool to visualize the propagation of seismic waves from historic earthquakes through Earth’s interior and around its surface. Easy-to-use controls speed-up, slow-down, or reverse the wave propagation. By carefully examining these seismic wave fronts and their propagation, the Seismic Waves tool illustrates how earthquakes can provide evidence that allows us to infer Earth’s interior structure.
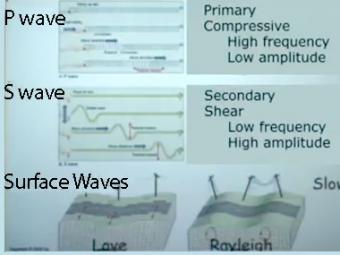
Video lecture on wave propagation and speeds of three fundamental kinds of seismic waves.
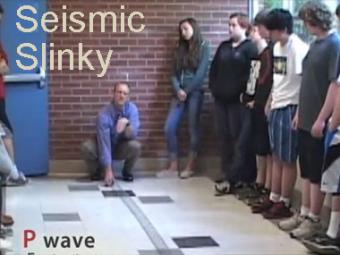
A video demonstration of how a slinky can be a good model for illustrating P & S seismic waves movement.
Students work first in small groups, and then as a whole class to compare predicted seismic wave travel times, generated by students from a scaled Earth model, to observed seismic data from a recent earthquakes. This activity uses models, real data and emphasizes the process of science.

To understand plate tectonic processes and hazards, and to better understand where future earthquakes are likely to occur, it is important to locate earthquakes as they occur. In this activity students use three-component seismic data from recent earthquakes to locate a global earthquake.
In this multi-step lab, students explore the concepts of seismic wave propagation through materials with different mechanical properties, and examine seismic evidence from a recent earthquake to infer Earth’s internal structure and composition. This lab is designed to be done with an instructor present to answer questions and guide students to conclusions
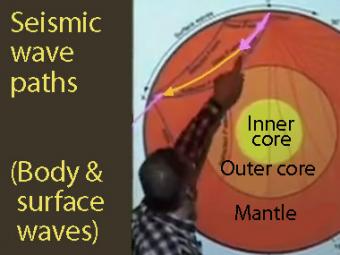
Seismic waves from earthquakes ricochet throughout Earth's interior and are recorded at geophysical observatories around the world. The paths of some of those seismic waves and the ground motion that they caused are used by seismologists to illuminate Earth's deep interior.
We encourage the reuse and dissemination of the material on this site as long as attribution is retained. To this end the material on this site, unless otherwise noted, is offered under Creative Commons Attribution (CC BY 4.0) license
