Intermediate
Students will be able to:
- Describe Earth’s internal structure (layers of different material properties and composition) and summarize how this is inferred through the analysis of seismic data
- Estimate the size of Earth’s core using a record section from a recent earthquake
- Describe how primary and secondary waves propagate through Earth
Differentiate between Earth’s asthenosphere and lithosphere (layers of different mechanical properties)
Students will be able to:
Students work first in small groups, and then as a whole class to compare predicted seismic wave travel times, generated by students from a scaled Earth model, to observed seismic data from a recent earthquakes. This activity uses models, real data and emphasizes the process of science.

Working in small groups of 3-4, students design and construct a seismograph using common household and craft materials provided. Students will demonstrate to the class (by shaking their table) how their seismographs records ground motion and if possible, the time of the disturbance occured.
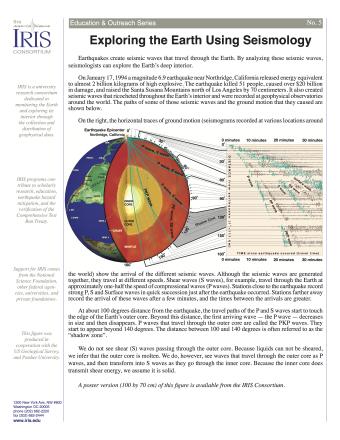
Earthquakes create seismic waves that travel through the Earth. By analyzing these seismic waves, seismologists can explore the Earth's deep interior. This fact sheet uses data from the 1994 magnitude 6.9 earthquake near Northridge, California to illustrate both this process and Earth's interior structure.
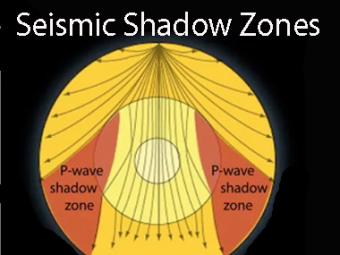
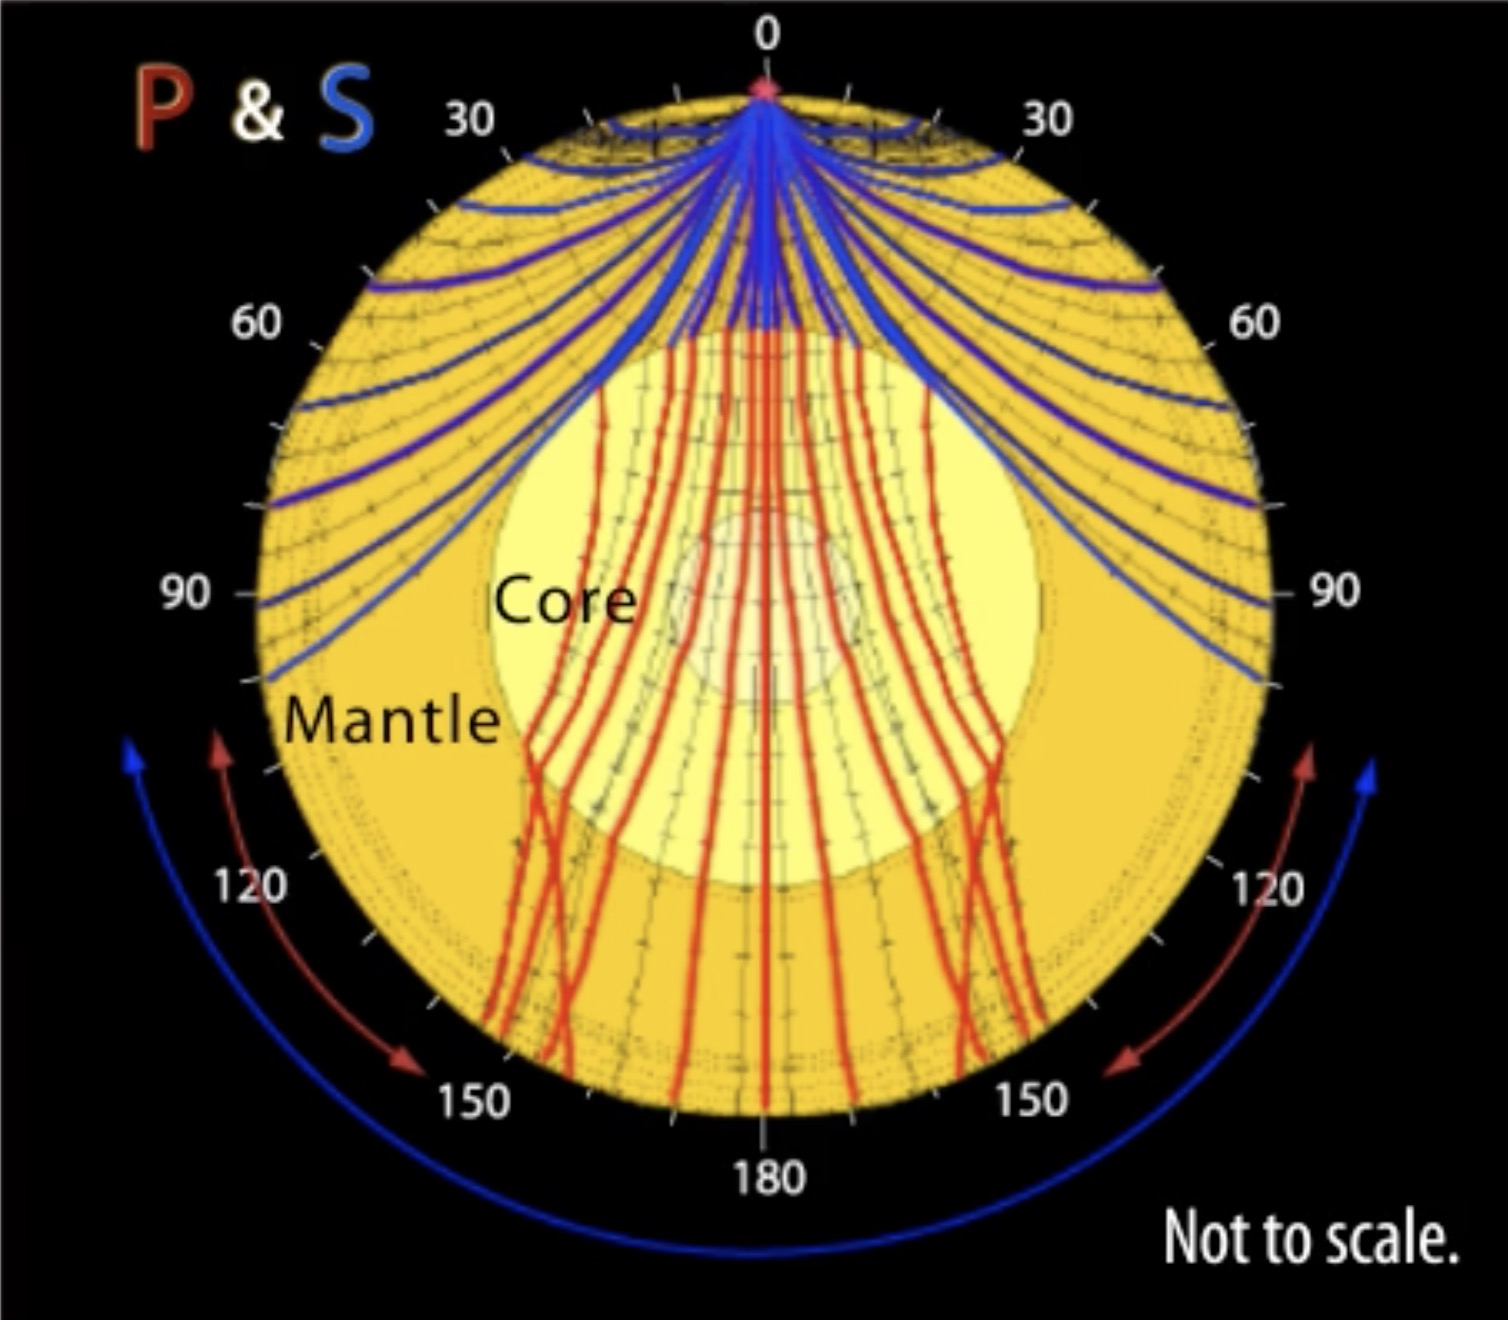
Seismic shadow zones have taught us much about the inside of the earth. This shows how P waves travel through solids and liquids, but S waves are stopped by the liquid outer core.
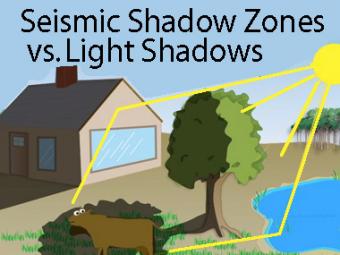
The wave properties of light are used as an analogy to help us understand seismic-wave behavior.
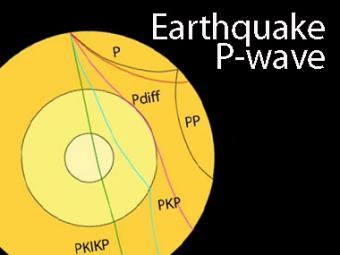
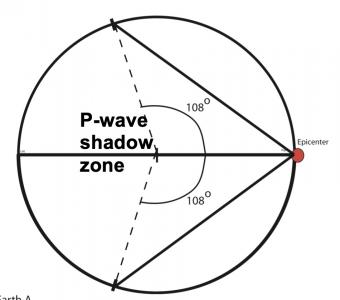
The shadow zone is the area of the earth from angular distances of 104 to 140 degrees from a given earthquake that does not receive any direct P waves. The different phases show how the initial P wave changes when encountering boundaries in the Earth.
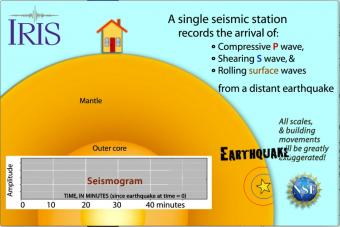
Seismic waves travel through the earth to a single seismic station. Scale and movement of the seismic station are greatly exaggerated to depict the relative motion recorded by the seismogram as P, S, and surface waves arrive.
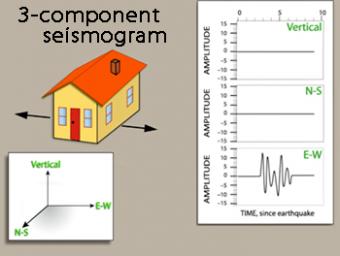
We use exaggerated motion of a building (seismic station) to show how the ground moves during an earthquake, and why it is important to measure seismic waves using 3 components: vertical, N-S, and E-W. Before showing an actual distant earthquake, we break down the three axes of movement to clarify the 3 seismograms.
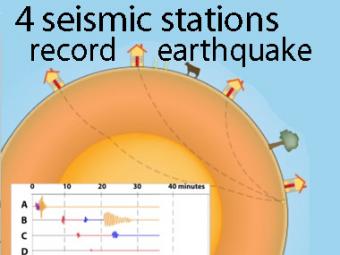
A cow and a tree in this narrated cartoon for fun and to emphasize that seismic waves traveling away from an earthquake occur everywhere, not just at seismic stations A, B, C, and D. A person would feel a large earthquake only at station A near the epicenter. Stations B, C, D, and the cow are too far from the earthquake to feel the seismic waves though sensitive equipment records their arrival.
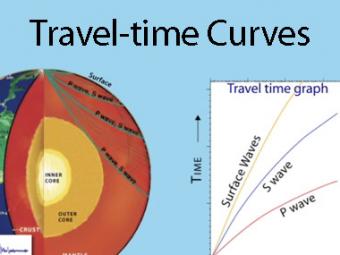
A travel time curve is a graph of the time that it takes for seismic waves to travel from the epicenter of an earthquake to the hundreds of seismograph stations around the world. The arrival times of P, S, and surface waves are shown to be predictable. This animates an IRIS poster linked with the animation.
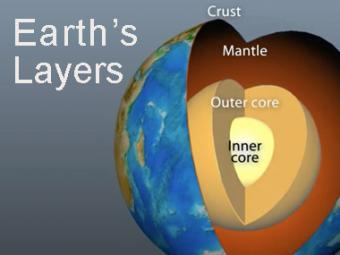
The Earth has 3 main layers based on chemical composition: crust, mantle, and core. Other layers are defined by physical characteristics due to pressure and temperature changes. This animation tells how the layers were discovered, what the layers are, and a bit about how the crust differs from the tectonic (lithospheric) plates, a distinction confused by many.
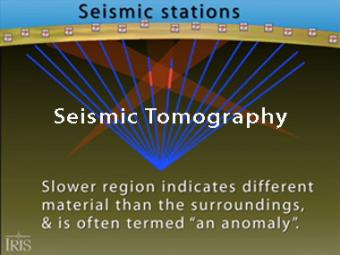
Seismic tomography is an imaging technique that uses seismic waves generated by earthquakes and explosions to create computer-generated, three-dimensional images of Earth's interior. CAT scans are often used as an analogy. Here we simplify things and make an Earth of uniform density with a slow zone that we image as a magma chamber.
Seismic shadow zones have taught us much about the inside of the earth. This shows how P waves travel through solids and liquids, but S waves are stopped by the liquid outer core.
The wave properties of light are used as an analogy to help us understand seismic-wave behavior.
The shadow zone is the area of the earth from angular distances of 104 to 140 degrees from a given earthquake that does not receive any direct P waves. The different phases show how the initial P wave changes when encountering boundaries in the Earth.
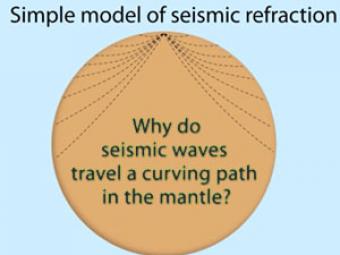
Seismic waves travel a curving path through the earth due to changes in composition, pressure, and temperature within the layers of the Earth.
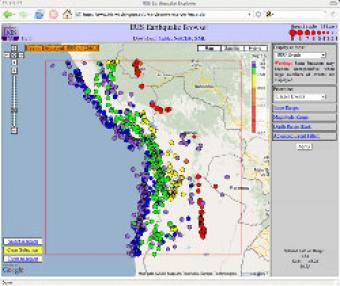
The IRIS Earthquake Browser (IEB) is an interactive tool for exploring millions of seismic event epicenters (normally earthquakes) on a map of the world. Selections of up to 5000 events can also be viewed in 3D and freely rotated with the 3D Viewer companion tool.
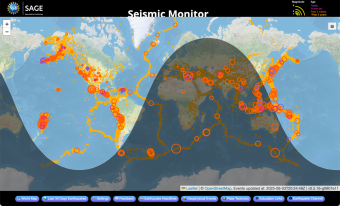
A beautiful map of the latest earthquakes in near-real time. The map also provides links to related resources, news, and connections to 3D maps.
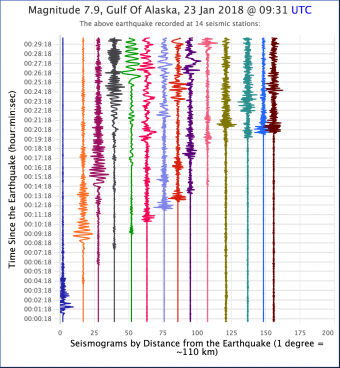
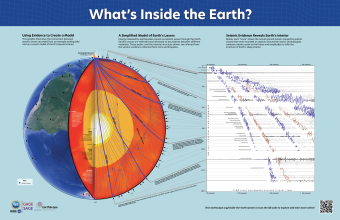
Seismic waves from earthquakes ricochet throughout Earth's interior and are recorded at geophysical observatories around the world. The paths of some of those seismic waves and the ground motion that they caused are used by seismologists to illuminate Earth's deep interior.
We encourage the reuse and dissemination of the material on this site as long as attribution is retained. To this end the material on this site, unless otherwise noted, is offered under Creative Commons Attribution (CC BY 4.0) license