Novice
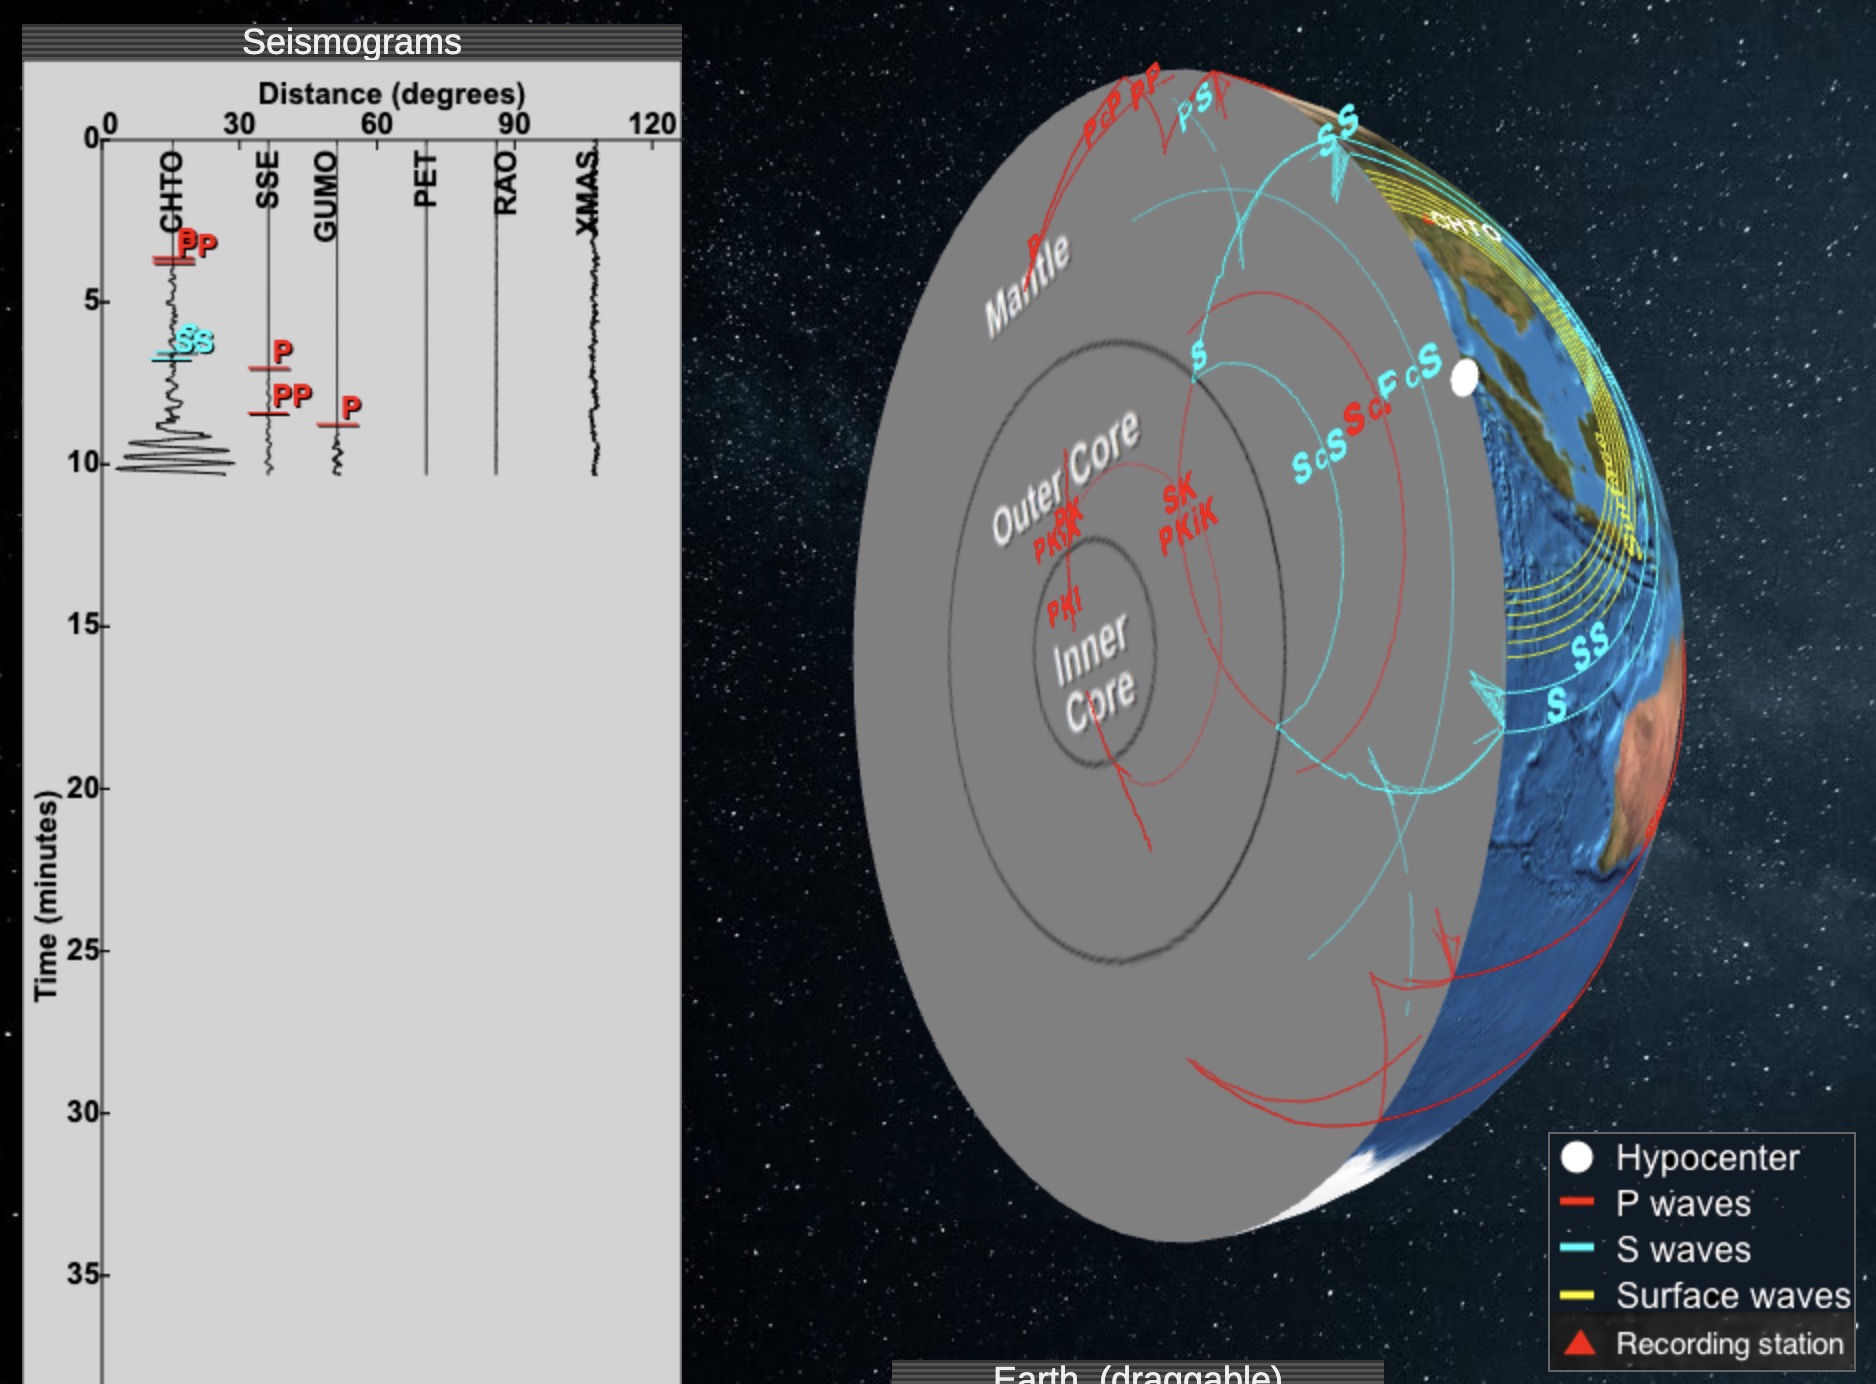
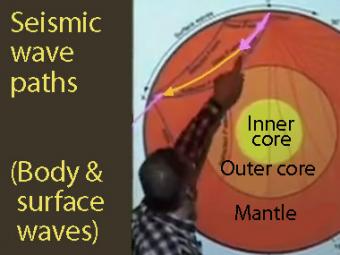
Seismic Waves is a browser-based tool to visualize the propagation of seismic waves from historic earthquakes through Earth’s interior and around its surface. Easy-to-use controls speed-up, slow-down, or reverse the wave propagation. By carefully examining these seismic wave fronts and their propagation, the Seismic Waves tool illustrates how earthquakes can provide evidence that allows us to infer Earth’s interior structure.
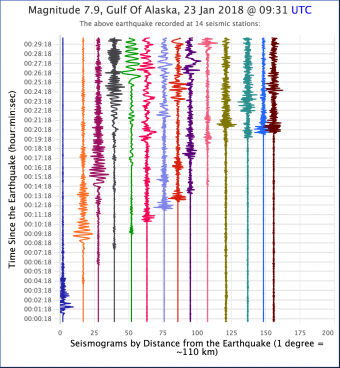
Shear waves (S waves), for example, travel through the Earth at approximately one-half the speed of compression waves (P waves). Stations close to the earthquake record strong P, S, and Surface waves in quick succession just after the earthquake occurred. Stations farther away record the arrival of these waves after a few minutes, and the times between the arrivals are greater.
The tool also illustrates how seismic waves inform our current understanding of Earth’s interior structure. Users will see that between approximately 104 and 140 degrees away from the epicenter, direct P waves do not arrive as they are refracted away from this zone. This suggests the presence of a lower velocity material, Earth’s outer core. Users will also observe that no direct S waves arrive beyond 104 degrees.
This web-based Seismic Waves Viewer mirros the functionality of the original Seismic Waves tool produced through a collaboration between Alan Jones & Jeff Baker (Binghamton University) and IRIS EPO. The original Seismic Waves runs on MS-Windows on PCs (Download .exe file here). You can learn more about Seismic Waves here. Jones, A. (2005). Using the Seismic Waves Program to Illustrate Wave Propogation Through the Earth. The Earth Scientist, 21(2), 26-27.
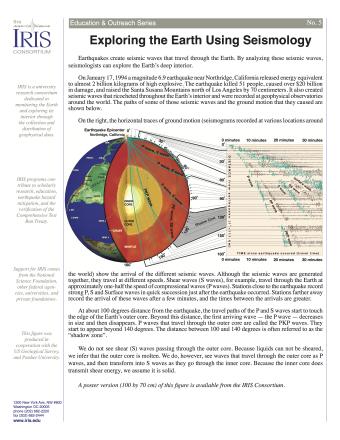
Earthquakes create seismic waves that travel through the Earth. By analyzing these seismic waves, seismologists can explore the Earth's deep interior. This fact sheet uses data from the 1994 magnitude 6.9 earthquake near Northridge, California to illustrate both this process and Earth's interior structure.
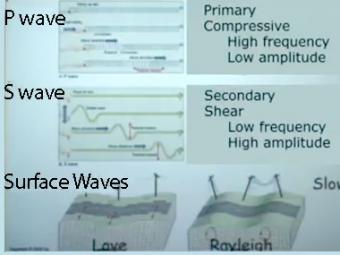
Video lecture on wave propagation and speeds of three fundamental kinds of seismic waves.
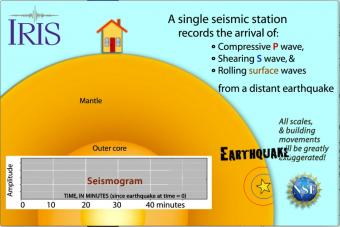
Seismic waves travel through the earth to a single seismic station. Scale and movement of the seismic station are greatly exaggerated to depict the relative motion recorded by the seismogram as P, S, and surface waves arrive.
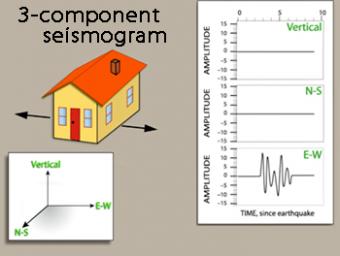
We use exaggerated motion of a building (seismic station) to show how the ground moves during an earthquake, and why it is important to measure seismic waves using 3 components: vertical, N-S, and E-W. Before showing an actual distant earthquake, we break down the three axes of movement to clarify the 3 seismograms.
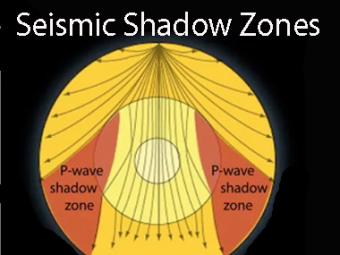
Seismic shadow zones have taught us much about the inside of the earth. This shows how P waves travel through solids and liquids, but S waves are stopped by the liquid outer core.
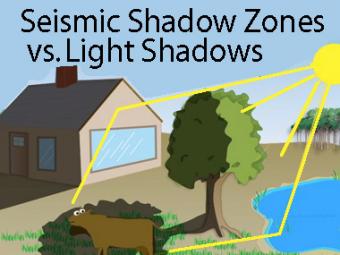
The wave properties of light are used as an analogy to help us understand seismic-wave behavior.
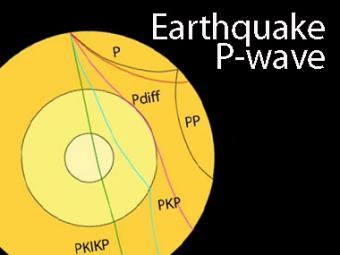
The shadow zone is the area of the earth from angular distances of 104 to 140 degrees from a given earthquake that does not receive any direct P waves. The different phases show how the initial P wave changes when encountering boundaries in the Earth.
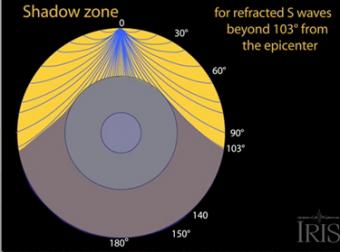
The shadow zone results from S waves being stopped entirely by the liquid core. Three different S-wave phases show how the initial S wave is stopped (damped), or how it changes when encountering boundaries in the Earth.
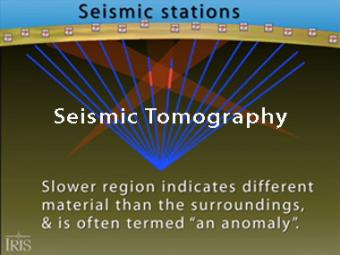
Seismic tomography is an imaging technique that uses seismic waves generated by earthquakes and explosions to create computer-generated, three-dimensional images of Earth's interior. CAT scans are often used as an analogy. Here we simplify things and make an Earth of uniform density with a slow zone that we image as a magma chamber.
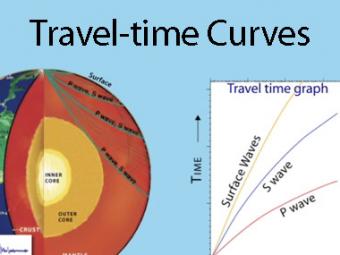
A travel time curve is a graph of the time that it takes for seismic waves to travel from the epicenter of an earthquake to the hundreds of seismograph stations around the world. The arrival times of P, S, and surface waves are shown to be predictable. This animates an IRIS poster linked with the animation.
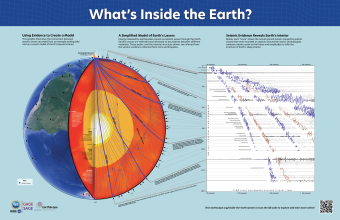
Seismic waves from earthquakes ricochet throughout Earth's interior and are recorded at geophysical observatories around the world. The paths of some of those seismic waves and the ground motion that they caused are used by seismologists to illuminate Earth's deep interior.
We encourage the reuse and dissemination of the material on this site as long as attribution is retained. To this end the material on this site, unless otherwise noted, is offered under Creative Commons Attribution (CC BY 4.0) license