Novice
New Version! Major Update!
- New color pallet!
- Interactive questions with feedback for students!
- Improved instructions!
- Embedded instructional videos!
- Downloadable certificate with student responses for completion!
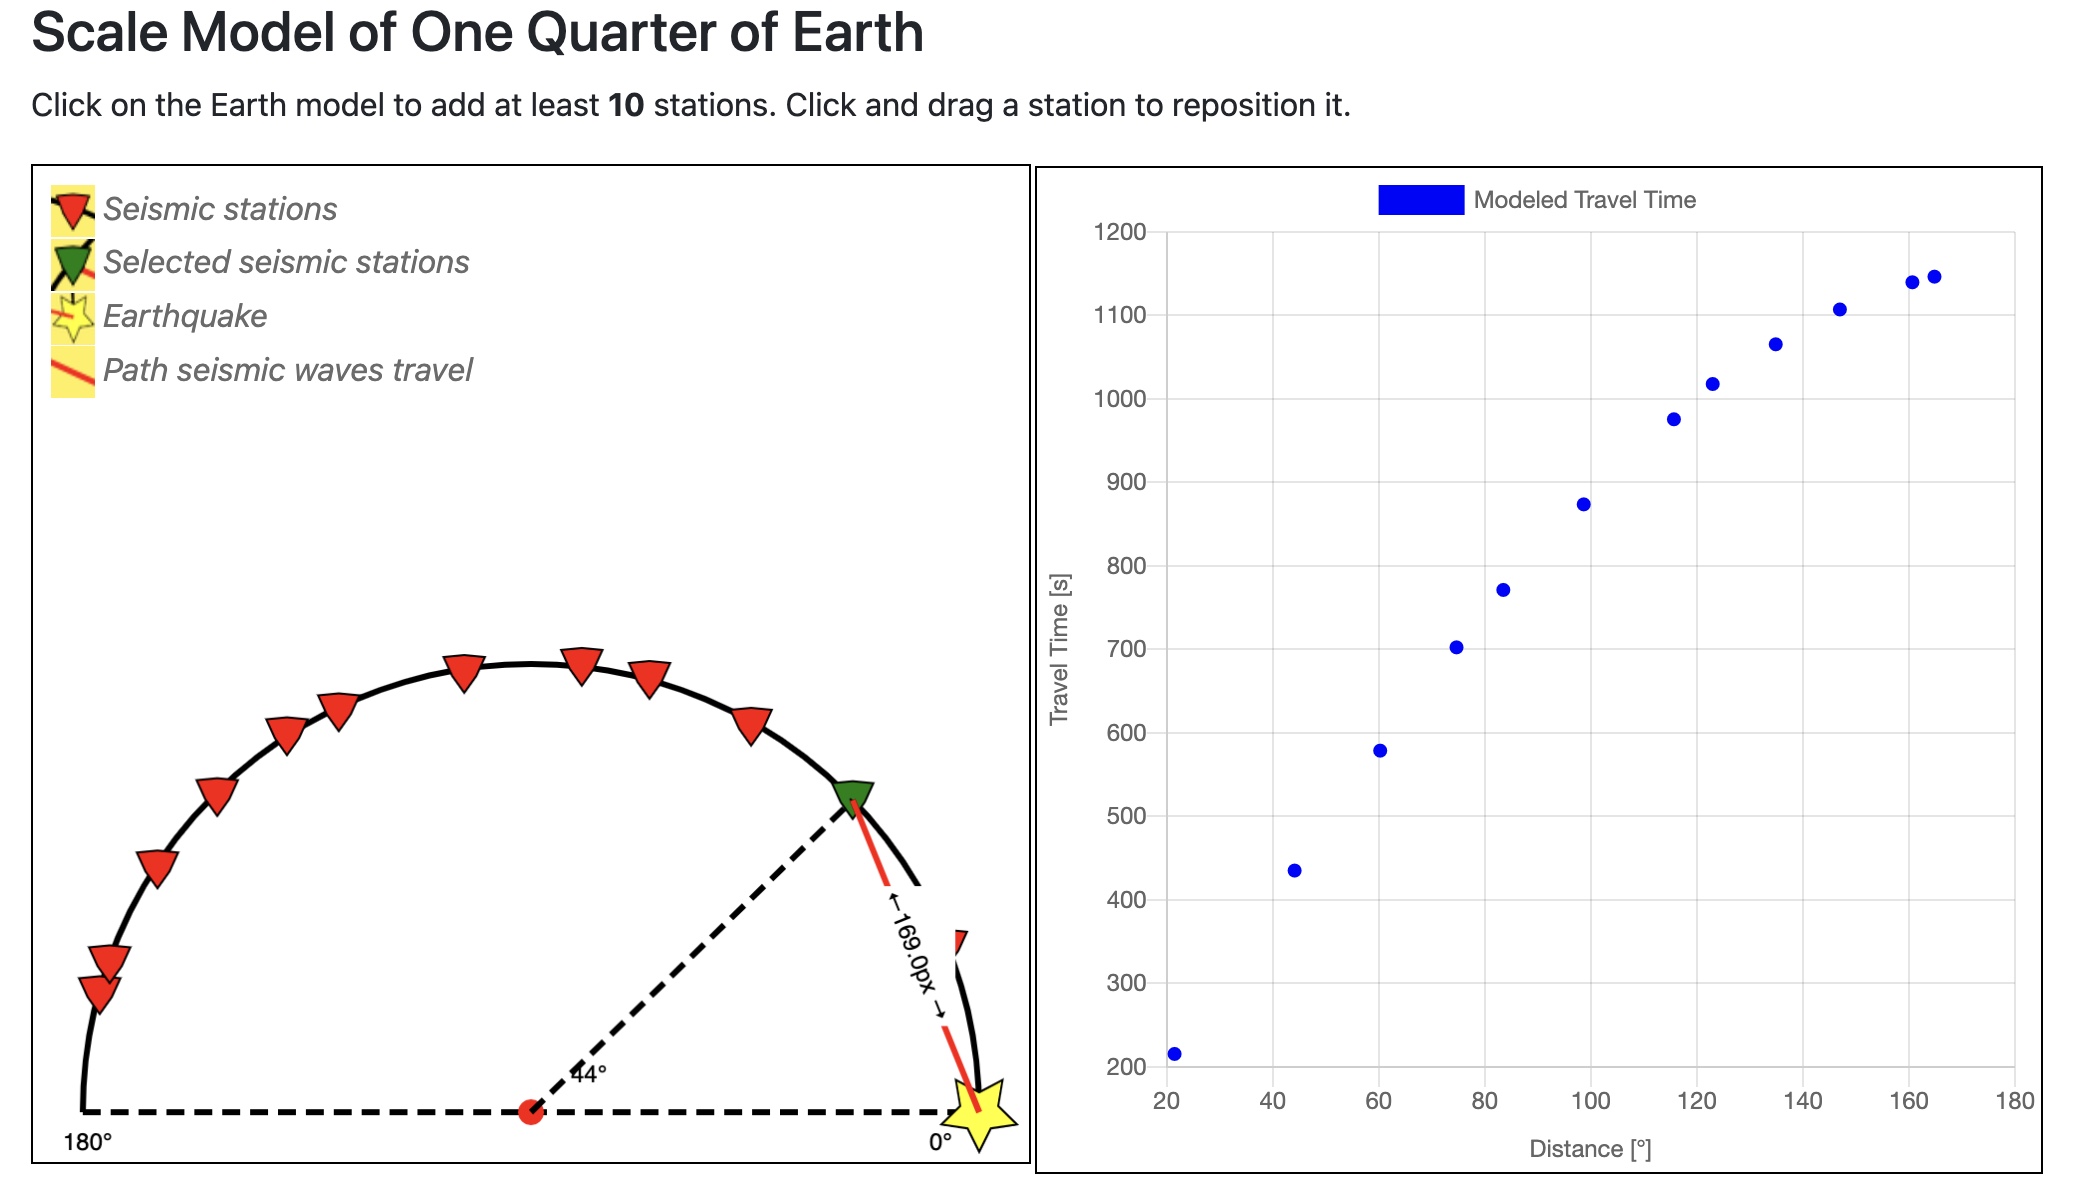
In this learning app, students compare observed seismic data to predictions they make from a model, to determine that the Earth must have a layered internal structure and to estimate the size of Earth's core. In the first step students examine seismic data from a recent earthquake to determine when seismic waves arrived at various points around Earth (observations). Then they use a model that is assumed to have a homogeneous interior with an average seismic wave velocity, to make predictions about when seismic waves should arrive at various points around Earth (predicted data). Students then compare their observations with their predictions to test the hypothesis that the Earth is homogeneous throughout. After comparing and discussing the fit of the predicted data with the observed data, students use a second scale model to further interpret these results. Ultimately, students measure the diameter of Earth's outer core based on their data and can compare it to widely accepted measurements.
Students will be able to:
Students work first in small groups, and then as a whole class to compare predicted seismic wave travel times, generated by students from a scaled Earth model, to observed seismic data from a recent earthquakes. This activity uses models, real data and emphasizes the process of science.
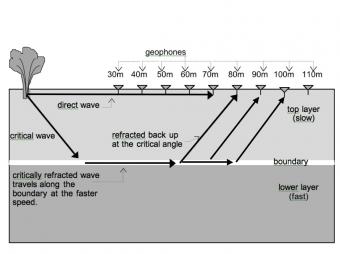
Like other waves, seismic waves obey the laws of physics. In this activity Physics students have the opportunity to apply their understanding of the basic concepts of waves (e.g. reflection, refraction and transmission of energy) as they examine seismic data to determine how far it is from the surface to the bedrock.
Seismic Waves is a browser-based tool to visualize the propagation of seismic waves from historic earthquakes through Earth’s interior and around its surface. Easy-to-use controls speed-up, slow-down, or reverse the wave propagation. By carefully examining these seismic wave fronts and their propagation, the Seismic Waves tool illustrates how earthquakes can provide evidence that allows us to infer Earth’s interior structure.
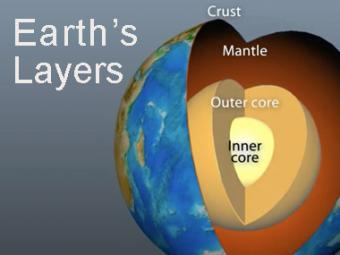
The Earth has 3 main layers based on chemical composition: crust, mantle, and core. Other layers are defined by physical characteristics due to pressure and temperature changes. This animation tells how the layers were discovered, what the layers are, and a bit about how the crust differs from the tectonic (lithospheric) plates, a distinction confused by many.
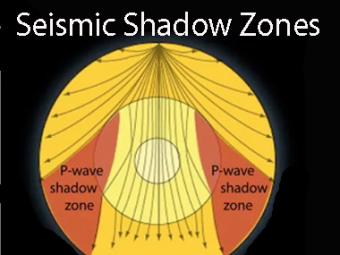
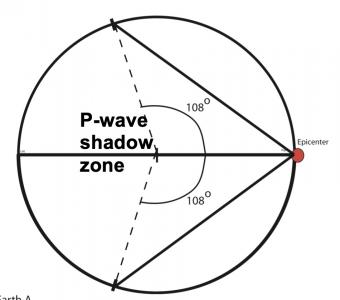
Seismic shadow zones have taught us much about the inside of the earth. This shows how P waves travel through solids and liquids, but S waves are stopped by the liquid outer core.
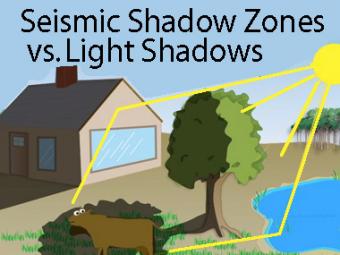
The wave properties of light are used as an analogy to help us understand seismic-wave behavior.
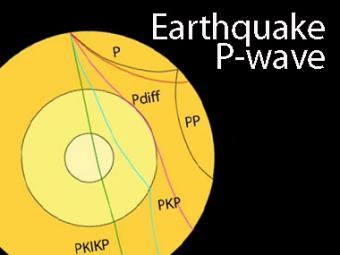
The shadow zone is the area of the earth from angular distances of 104 to 140 degrees from a given earthquake that does not receive any direct P waves. The different phases show how the initial P wave changes when encountering boundaries in the Earth.
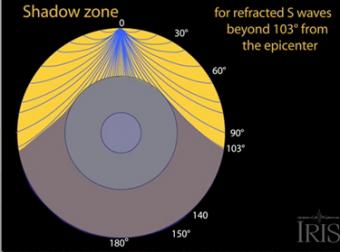
The shadow zone results from S waves being stopped entirely by the liquid core. Three different S-wave phases show how the initial S wave is stopped (damped), or how it changes when encountering boundaries in the Earth.
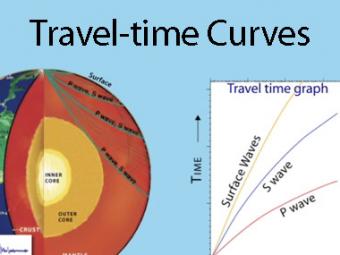
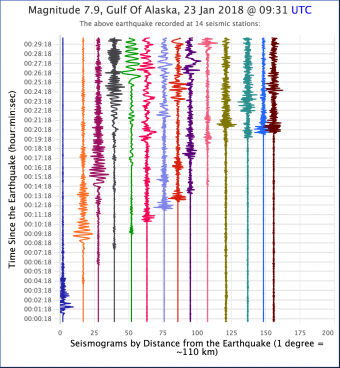
A travel time curve is a graph of the time that it takes for seismic waves to travel from the epicenter of an earthquake to the hundreds of seismograph stations around the world. The arrival times of P, S, and surface waves are shown to be predictable. This animates an IRIS poster linked with the animation.
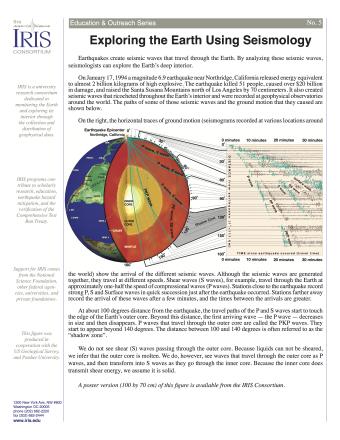
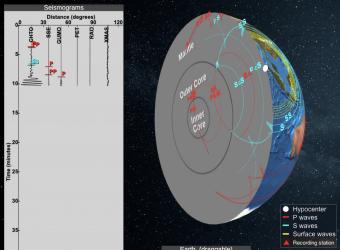
Earthquakes create seismic waves that travel through the Earth. By analyzing these seismic waves, seismologists can explore the Earth's deep interior. This fact sheet uses data from the 1994 magnitude 6.9 earthquake near Northridge, California to illustrate both this process and Earth's interior structure.
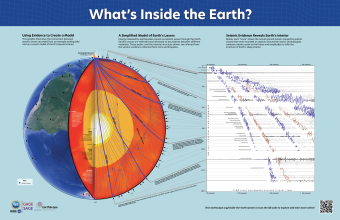
Seismic waves from earthquakes ricochet throughout Earth's interior and are recorded at geophysical observatories around the world. The paths of some of those seismic waves and the ground motion that they caused are used by seismologists to illuminate Earth's deep interior.
We encourage the reuse and dissemination of the material on this site as long as attribution is retained. To this end the material on this site, unless otherwise noted, is offered under Creative Commons Attribution (CC BY 4.0) license