
Intermediate
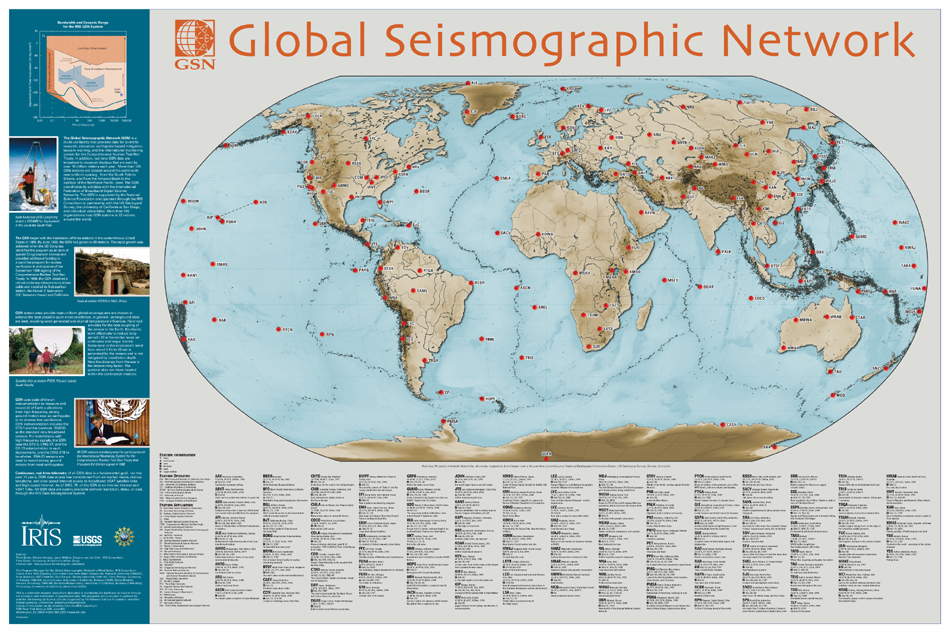
The Global Seismographic Network (GSN) consists of more than 125 GSN stations located around the world with near-uniform spacing - from the South Pole to Siberia, and from the Amazon Basin to the seafloor of the Northeast Pacific Ocean. This multi-use facility provides data for scientific research, education, earthquake hazard mitigation, tsunami warning, and the international monitoring system for the Comprehensive Nuclear Test-Ban Treaty. In addition, real-time GSN data are broadcast to museum displays that are seen by over 10 million visitors each year.
ORDERING INFORMATION: Our apologies! THIS POSTER IS CURRENTLY OUT OF PRINT
Requesting Posters:
THIS POSTER IS CURRENTLY OUT OF PRINT
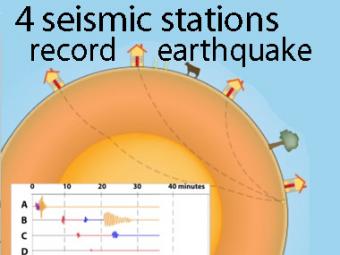
A cow and a tree in this narrated cartoon for fun and to emphasize that seismic waves traveling away from an earthquake occur everywhere, not just at seismic stations A, B, C, and D. A person would feel a large earthquake only at station A near the epicenter. Stations B, C, D, and the cow are too far from the earthquake to feel the seismic waves though sensitive equipment records their arrival.
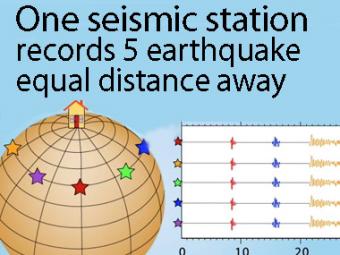
A gridded sphere is used to show a single station recording five equidistant earthquakes.
A gridded sphere is used to show:
1) the seismic stations don't need to be lined up longitudinally to create travel-time curves,
as they appear in the first animation, and
2) a single station records widely separated earthquakes that plot on the travel-time curves.
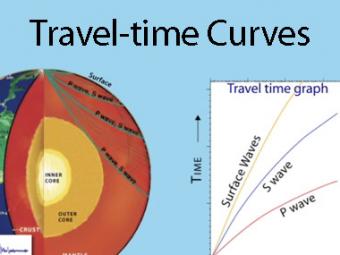
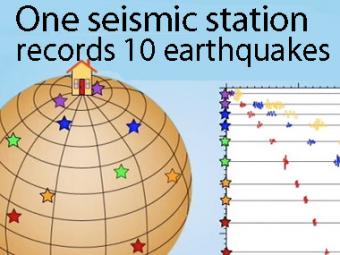
A travel time curve is a graph of the time that it takes for seismic waves to travel from the epicenter of an earthquake to the hundreds of seismograph stations around the world. The arrival times of P, S, and surface waves are shown to be predictable. This animates an IRIS poster linked with the animation.
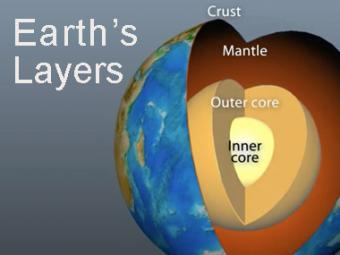
The Earth has 3 main layers based on chemical composition: crust, mantle, and core. Other layers are defined by physical characteristics due to pressure and temperature changes. This animation tells how the layers were discovered, what the layers are, and a bit about how the crust differs from the tectonic (lithospheric) plates, a distinction confused by many.
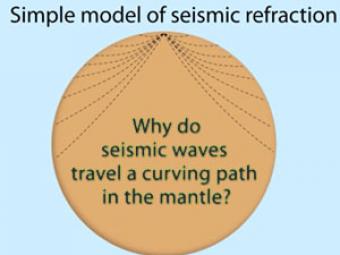
Seismic waves travel a curving path through the earth due to changes in composition, pressure, and temperature within the layers of the Earth.
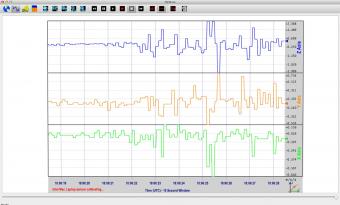
QCNLive is interactive software developed for hands-on education about Earthquake Seismology. There are several modules within QCNLive for learning about earthquake vibrations and where earthquakes occur. The software measures and plots real-time motions acquired from several types of internal and/or external Micro-Electro-Mechanical System (MEMS).
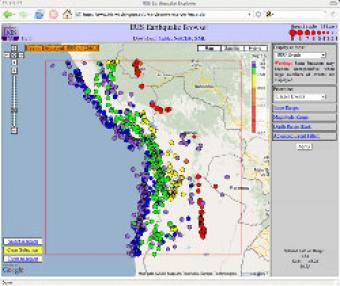
The IRIS Earthquake Browser (IEB) is an interactive tool for exploring millions of seismic event epicenters (normally earthquakes) on a map of the world. Selections of up to 5000 events can also be viewed in 3D and freely rotated with the 3D Viewer companion tool.
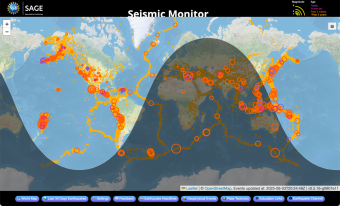
A beautiful map of the latest earthquakes in near-real time. The map also provides links to related resources, news, and connections to 3D maps.
We encourage the reuse and dissemination of the material on this site as long as attribution is retained. To this end the material on this site, unless otherwise noted, is offered under Creative Commons Attribution (CC BY 4.0) license
