
Novice
Can you show me the different shadow zones alone and at once?
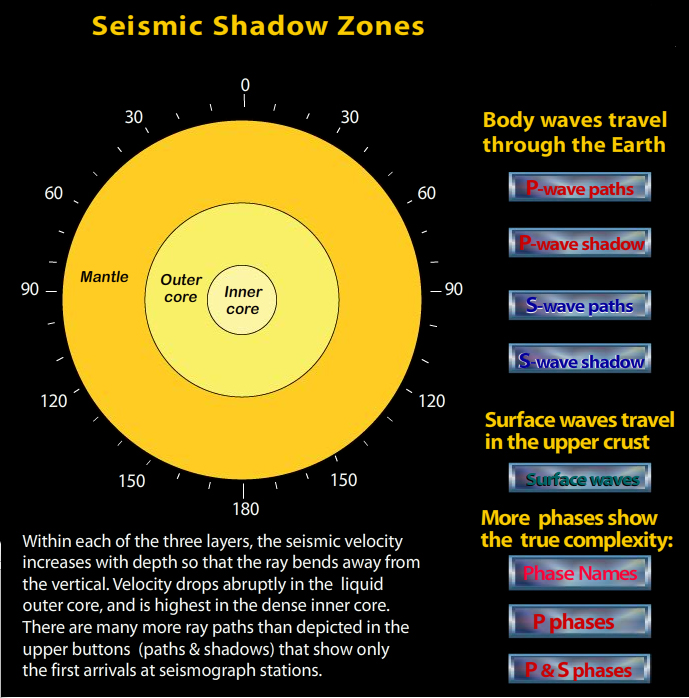
This rollover shows the different P and S phases and their respective shadow zones.
ABOUT TO GO AWAY: IRIS is going to discontinue Flash animations in 2020. If you have a Flash player app and would like a copy, download this .swf file.
This rollover shows the different P and S phases and their respective shadow zones.
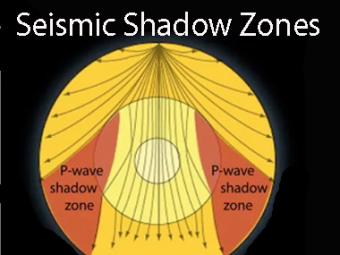
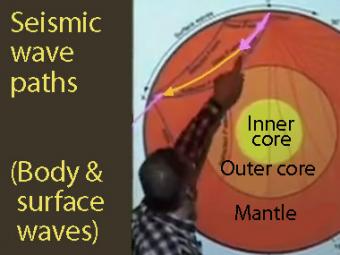
Seismic shadow zones have taught us much about the inside of the earth. This shows how P waves travel through solids and liquids, but S waves are stopped by the liquid outer core.
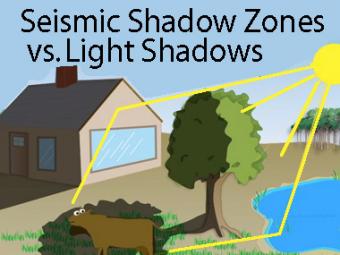
The wave properties of light are used as an analogy to help us understand seismic-wave behavior.
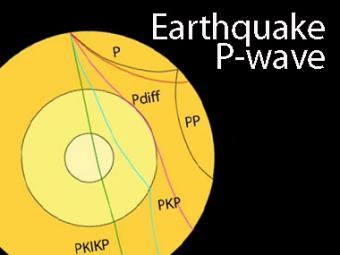
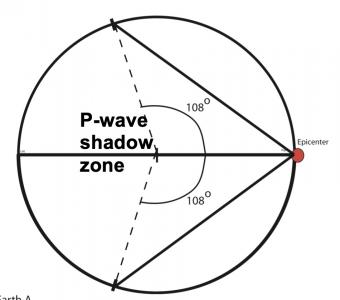
The shadow zone is the area of the earth from angular distances of 104 to 140 degrees from a given earthquake that does not receive any direct P waves. The different phases show how the initial P wave changes when encountering boundaries in the Earth.
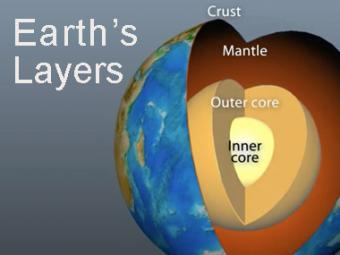
The Earth has 3 main layers based on chemical composition: crust, mantle, and core. Other layers are defined by physical characteristics due to pressure and temperature changes. This animation tells how the layers were discovered, what the layers are, and a bit about how the crust differs from the tectonic (lithospheric) plates, a distinction confused by many.
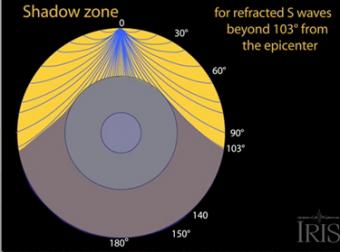
The shadow zone results from S waves being stopped entirely by the liquid core. Three different S-wave phases show how the initial S wave is stopped (damped), or how it changes when encountering boundaries in the Earth.
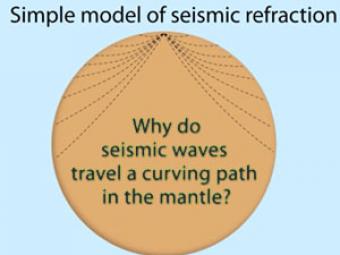
Seismic waves travel a curving path through the earth due to changes in composition, pressure, and temperature within the layers of the Earth.
Students work first in small groups, and then as a whole class to compare predicted seismic wave travel times, generated by students from a scaled Earth model, to observed seismic data from a recent earthquakes. This activity uses models, real data and emphasizes the process of science.
We encourage the reuse and dissemination of the material on this site as long as attribution is retained. To this end the material on this site, unless otherwise noted, is offered under Creative Commons Attribution (CC BY 4.0) license
