Intermediate
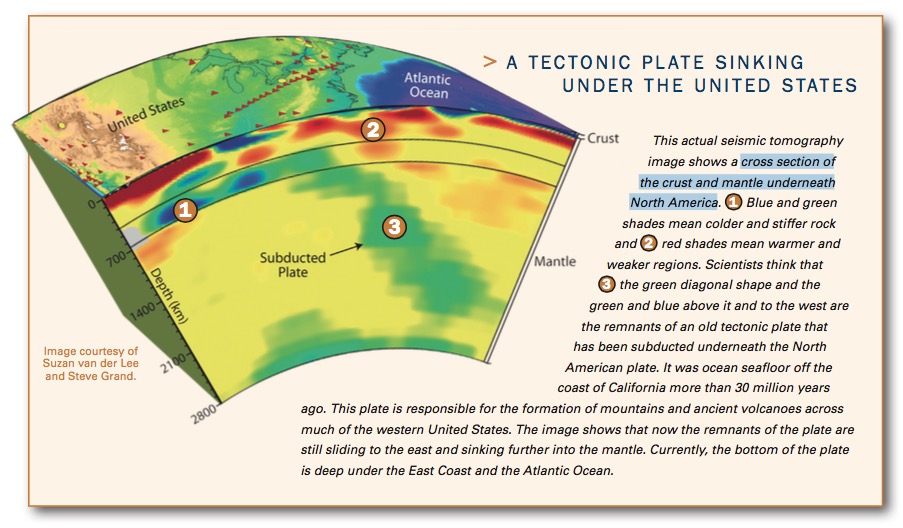
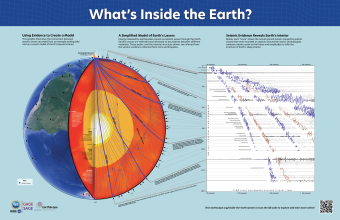
When scientists want to know more about the rocks deep inside the Earth, they must use other methods because they can’t observe the rocks directly with their senses. Using a technique called seismic tomography, scientists decode the information contained in seismograms’ squiggles to develop images of individual slices through the deep Earth. These images are used to understand not only the composition of Earth’s interior, but also to help explain geologic mysteries, like how the Sierra Nevada mountains formed and why there has been so much volcanism in eastern Oregon.
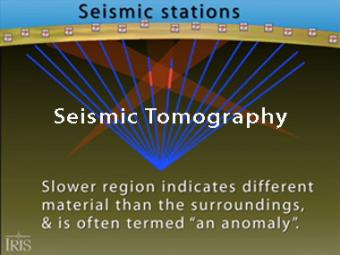
Seismic tomography is an imaging technique that uses seismic waves generated by earthquakes and explosions to create computer-generated, three-dimensional images of Earth's interior. CAT scans are often used as an analogy. Here we simplify things and make an Earth of uniform density with a slow zone that we image as a magma chamber.
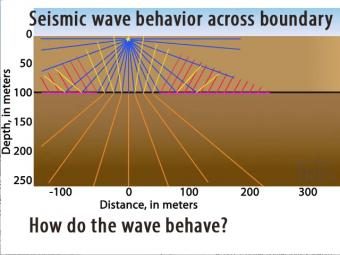
Seismic waves travel at different speeds through different materials. In this 2-layer model two wave fronts leave an impact at the same time but the lower layer is faster.
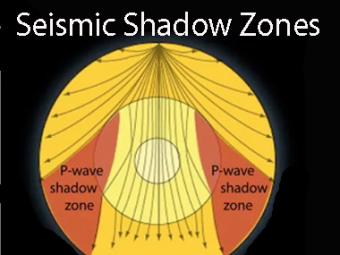
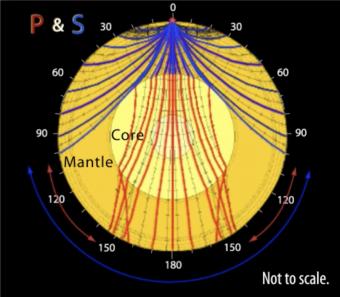
Seismic shadow zones have taught us much about the inside of the earth. This shows how P waves travel through solids and liquids, but S waves are stopped by the liquid outer core.
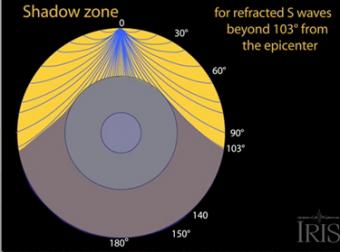
The shadow zone results from S waves being stopped entirely by the liquid core. Three different S-wave phases show how the initial S wave is stopped (damped), or how it changes when encountering boundaries in the Earth.
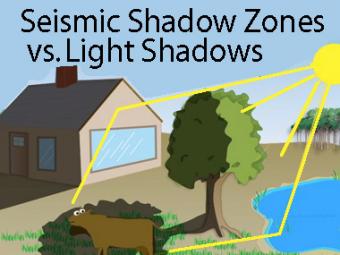
The wave properties of light are used as an analogy to help us understand seismic-wave behavior.
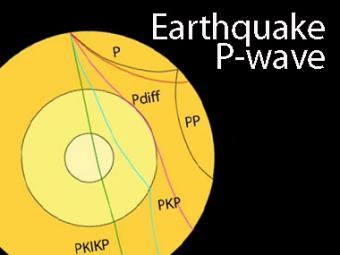
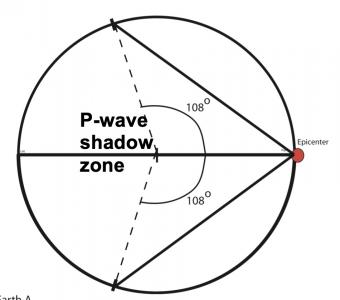
The shadow zone is the area of the earth from angular distances of 104 to 140 degrees from a given earthquake that does not receive any direct P waves. The different phases show how the initial P wave changes when encountering boundaries in the Earth.
Students work first in small groups, and then as a whole class to compare predicted seismic wave travel times, generated by students from a scaled Earth model, to observed seismic data from a recent earthquakes. This activity uses models, real data and emphasizes the process of science.
In this multi-step lab, students explore the concepts of seismic wave propagation through materials with different mechanical properties, and examine seismic evidence from a recent earthquake to infer Earth’s internal structure and composition. This lab is designed to be done with an instructor present to answer questions and guide students to conclusions
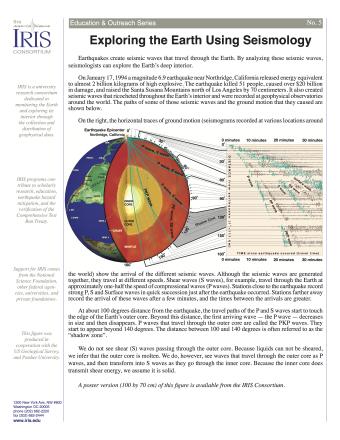
Earthquakes create seismic waves that travel through the Earth. By analyzing these seismic waves, seismologists can explore the Earth's deep interior. This fact sheet uses data from the 1994 magnitude 6.9 earthquake near Northridge, California to illustrate both this process and Earth's interior structure.
Seismic waves from earthquakes ricochet throughout Earth's interior and are recorded at geophysical observatories around the world. The paths of some of those seismic waves and the ground motion that they caused are used by seismologists to illuminate Earth's deep interior.
We encourage the reuse and dissemination of the material on this site as long as attribution is retained. To this end the material on this site, unless otherwise noted, is offered under Creative Commons Attribution (CC BY 4.0) license