
Intermediate
The Transportable Array (TA) component of the USArray/EarthScope project is a rolling array of 400 broadband stations deployed on a uniform 70-km grid (map ). Ground motion data recorded by this very large aperture array, along with those recorded by other stations from USArray, are used for visualization of seismic waves as they cross the contiguous United States.
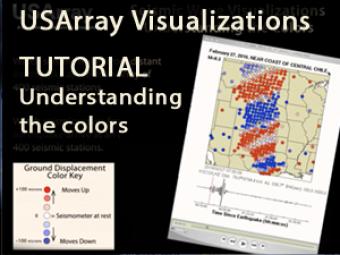
The USArray Ground Motion Visualization (GMV) is a video-based IRIS DMS product that illustrates how seismic waves travel away from an earthquake location by depicting the normalized recorded wave amplitudes at each seismometer location using colored symbols (see maps below). The color of each symbol depicts the amplitude of the vertical ground motion, as detected by the station’s seismometer (for TA stations this represents velocity of ground movement) and normalized to its peak amplitude. The color changes as waves of differing amplitude travel past the seismometer. Blue indicates downward ground motion while red represents upward ground motion with the darker colors indicating larger amplitudes.
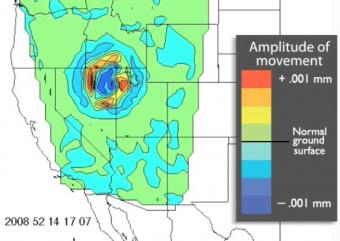
Data visualization of the data generated by over 400 seismograph stations in response to the February 21, 2008 earthquake in Wells, NV.
As earthquake waves travel along the surface of the Earth, they cause the ground to move. The ground motions can be captured and displayed as a movie, providing a visual demonstration of these often indiscernible movements.
We encourage the reuse and dissemination of the material on this site as long as attribution is retained. To this end the material on this site, unless otherwise noted, is offered under Creative Commons Attribution (CC BY 4.0) license
