1min 18s Novice
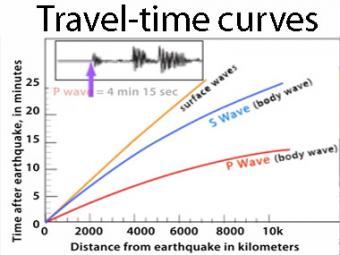
A travel time curve is a graph of the time that it takes for seismic waves to travel from the epicenter of an earthquake to the hundreds of seismograph stations around the world. The arrival times of P, S, and surface waves are shown to be predictable. This animates an IRIS poster linked with the animation.
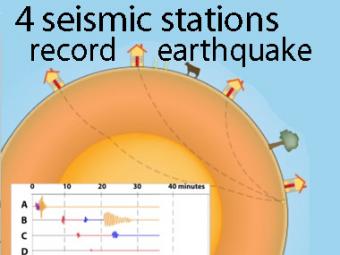
A cow and a tree in this narrated cartoon for fun and to emphasize that seismic waves traveling away from an earthquake occur everywhere, not just at seismic stations A, B, C, and D. A person would feel a large earthquake only at station A near the epicenter. Stations B, C, D, and the cow are too far from the earthquake to feel the seismic waves though sensitive equipment records their arrival.
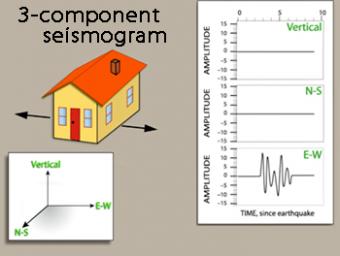
We use exaggerated motion of a building (seismic station) to show how the ground moves during an earthquake, and why it is important to measure seismic waves using 3 components: vertical, N-S, and E-W. Before showing an actual distant earthquake, we break down the three axes of movement to clarify the 3 seismograms.
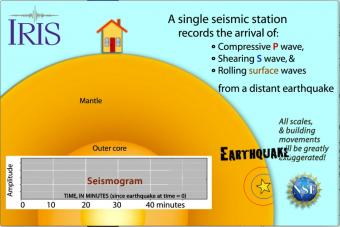
Seismic waves travel through the earth to a single seismic station. Scale and movement of the seismic station are greatly exaggerated to depict the relative motion recorded by the seismogram as P, S, and surface waves arrive.
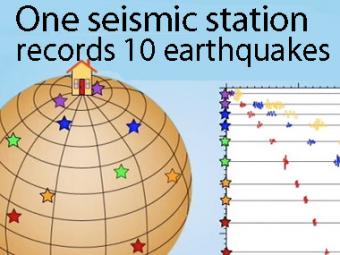
A gridded sphere is used to show:
1) the seismic stations don't need to be lined up longitudinally to create travel-time curves,
as they appear in the first animation, and
2) a single station records widely separated earthquakes that plot on the travel-time curves.
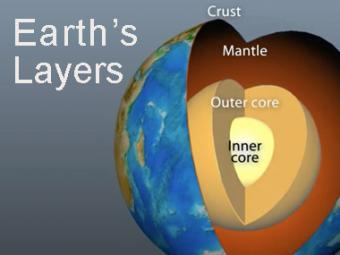
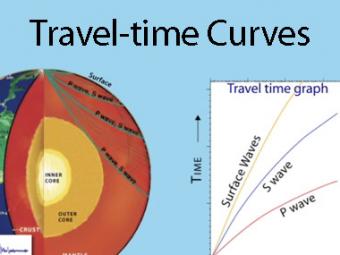
The Earth has 3 main layers based on chemical composition: crust, mantle, and core. Other layers are defined by physical characteristics due to pressure and temperature changes. This animation tells how the layers were discovered, what the layers are, and a bit about how the crust differs from the tectonic (lithospheric) plates, a distinction confused by many.

To understand plate tectonic processes and hazards, and to better understand where future earthquakes are likely to occur, it is important to locate earthquakes as they occur. In this activity students use three-component seismic data from recent earthquakes to locate a global earthquake.
We encourage the reuse and dissemination of the material on this site as long as attribution is retained. To this end the material on this site, unless otherwise noted, is offered under Creative Commons Attribution (CC BY 4.0) license