
1h 15min Advanced
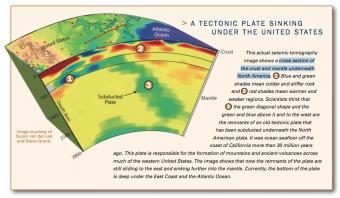
A (one might say the) fundamental problem in science is finding a mathematical representation or model (m), hopefully with predictive or insight benefits, that describes observable data (d). If we knew the velocity structure of the Earth exactly (m), we could use basic physics principles (e.g. Snell's Law) to trace the path a seismic wave would take from a source (for instance an earthquake or explosion) to a seismometer. The calculation of the travel time (d) from the source to the seismometer is called a "Forward Problem," and can be calculated by integrating the inverse velocity (or "slowness") along the ray-path. However, we are not able to physically sample much of the Earth's interior to get seismic velocity estimates (the deepest hole ever drilled is only ~0.2% of the Earth's radius!). One of the classic problems in seismology, called "seismic tomography," is to take travel times from seismic sources to seismometers (d) and "invert" for the velocity structure of Earth (m). Seismic tomography is of fundamental importance to Earth Science as understanding the velocity structure of Earth gives us valuable information about the composition, temperature, and phase of material within the planet. A exercise introduces inverse theory by having students solve for the velocity structure of a 4 blocks in a 2x2 grid.
Author: Rick Aster, Professor of Geophysics, Colorado State University (Rick.Aster "at" colostate.edu)
Students will be able to:
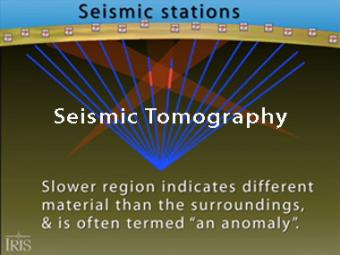
Seismic tomography is an imaging technique that uses seismic waves generated by earthquakes and explosions to create computer-generated, three-dimensional images of Earth's interior. CAT scans are often used as an analogy. Here we simplify things and make an Earth of uniform density with a slow zone that we image as a magma chamber.
Introductory description of how seismic tomography is used to determine Earth structure.
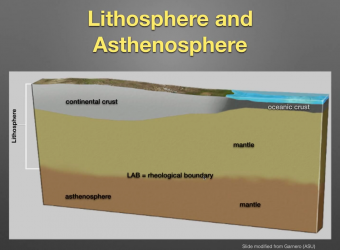
This webinar, presented by Caroline Beghein of the University of California-Los Angeles, explores the origin of the lithosphere-asthenosphere boundary (LAB) and the Gutenberg (G) seismic discontinuity.
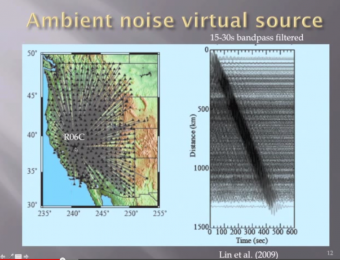
Seismic waves that propagate through the earth's interior are important tools to study earth structure. Large scale seismic arrays promote the development of new data analysis methods, like surface-wave tomography and seismic interferometry. This webinar, presented by Fan-Chi Lin of Caltech, demonstrates how different types of seismic maps are determined based on array analysis and how different seismic phases can be extracted from seismic noise to reveal detailed earth structure.
We encourage the reuse and dissemination of the material on this site as long as attribution is retained. To this end the material on this site, unless otherwise noted, is offered under Creative Commons Attribution (CC BY 4.0) license

