1h 30min Advanced
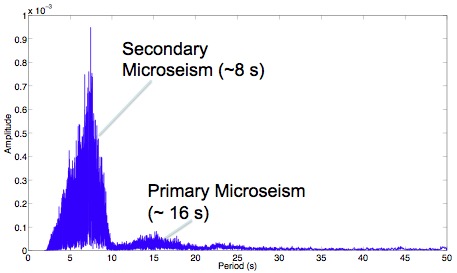
The object of this lab is to explore the relationship between the time domain and the frequency domain while being introduced to the numerical computing program MATLAB. Students first look at pure sine waves and their superpositions as a function of time and their representation in the frequency domain, and then move on to examine similar features in earthquake data.
This exercise was last updated (5/30/14) by Rob Anthony, Colorado State U. (ranthony3036@gmail.com) and used as part of the IRIS Internship Orientation Week.
Students will be able to:
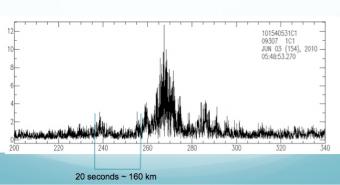
This tutorial provides student with basic tools and procedures generally used to explore broadband seismic data in Matlab.
This webinar, presented by Loren Shure of MathWorks, shows viewers how to access and visualize data from earthquakes with MATLAB. MATLAB has many capabilities to work with and visualize data, and this webinar includes examples and case studies, technical answers from the community, and the various resources from MathWorks that can help answer your questions about MATLAB.
We encourage the reuse and dissemination of the material on this site as long as attribution is retained. To this end the material on this site, unless otherwise noted, is offered under Creative Commons Attribution (CC BY 4.0) license