Date: November 1, 2016 1h 35min Advanced
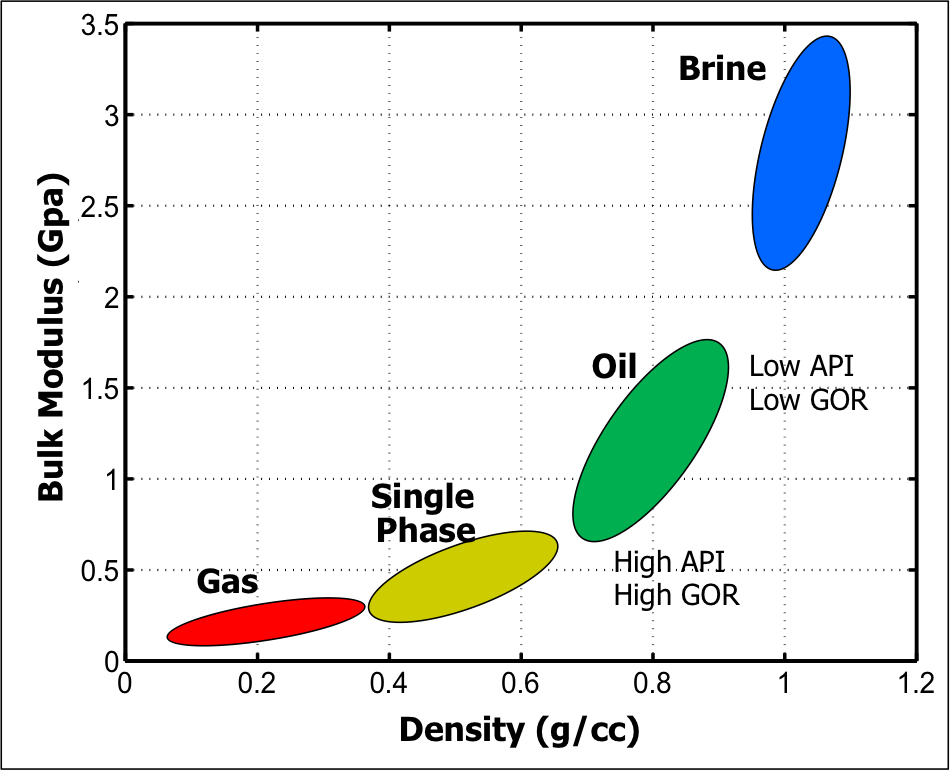
Seismic direct hydrocarbon indicators (DHIs) are anomalous seismic responses caused by the presence of hydrocarbons. DHIs occur when a change in pore fluids causes a change in the elastic properties of the bulk rock which is seismically detectable (i.e. there is a “fluid effect”). DHIs display one or more types of characteristics that are consistent with hydrocarbons filling pores in a rock matrix.
Divide the class time into four (4) segments: (1) review the previous exercise, (2) introduce the lecture, (3), introduce the exercise, parts A and B, and (4) introduce the exercise part C. The review of the previous exercise has eleven (11) slides, and will take ~18 minutes to explain. The lecture material has thirty-nine (39) slides, and takes ~57 minutes to explain. The introduction to the exercise parts A and B has three (3) slides, and takes ~8 minutes to explain. The introduction to exercise part C has eight (8) slides, and takes ~12 minutes to explain.
In the exercise, students will perform a series of calculations given velocities and densities for a shale and a sand filled with water (brine), oil and gas. The values are representative for the Gulf of Mexico (part A) and the North Sea (part B). In step 2, they calculate impedance, which is velocity * density. In step 3, they calculate reflection coefficients for five (5) interfaces. These five (5) interfaces correspond to locations A through E on Figure 1. Figure 1 shows a simple, zero phase wavelet for location A. Students are to draw approximate wavelets at locations B, C, D and E. If the reflection coefficient (RC) sign at location B is the same as at location A, then the wavelet will have the same polarity at B as at A. If the sign is opposite, then the wavelet will be flipped (opposite polarity) at location B. If the magnitude (absolute value) of the RC at B is about the same as the magnitude of the RC at A, then the wavelet amplitude at B is about the same as the wavelet amplitude at A. If B has ½ the magnitude at A, then the wavelet amplitude at B will be ½ that at A. The same goes for locations C, D and E. This exercise should take about fifteen (15) minutes.
In part C, the students map the gas-water contact (GWC) at the Barracouta Field. They are given inline 1915, which passes through the discovery well, with the top and base of the reservoir and the GWC interpreted. They are also given six (6) crosslines with interpretation. There are seven (7) inlines without interpretation. Using the loop-tie method, students are to interpret the top of the reservoir and the GWC on these inlines. They want to determine where the top of reservoir horizon is intercepted by the GWC “horizon.” The last step is to mark the extent of the gas on the inlines and crosslines on the basemap and then draw a polygon to mark the extent of the field (based on seismic evidence). This exercise should take about 20 minutes.
At the end of this lesson, students should be able to:
This course, based on teaching material from Dr. Fred Schroeder (formerly of Exxon/ExxonMobil), reflects on the geology and geophysics basics for the petroleum industry. General geology and basic geophysics are not required, but helpful with the material.
We encourage the reuse and dissemination of the material on this site as long as attribution is retained. To this end the material on this site, unless otherwise noted, is offered under Creative Commons Attribution (CC BY 4.0) license