Date: November 1, 2016 1h 15min Advanced
We can take seismic data and process it to include all offsets (full stack) or select offsets (partial stacks). For hydrocarbon (HC) analysis, we often get a near-angle stack and a far-angle stack. The difference in amplitude for a target interval on near vs. far stacks can indicate the type of fluid within the pore space of a reservoir rock. Amplitude vs. offset (AVO) analysis examines such amplitude differences. Based on physics, we are more interest in AVA, amplitude versus angle, than AVO.
Divide the class time into five (5) segments:review the previous exercise (1) part A, (2) part B, and (3) part C, then (4) introduce the lecture material and (5) introduce the exercise. The review of the previous exercise part A has two (2) slides, and will take ~5 minutes to explain. The review of the previous exercise part B has two (2) slides, and will take ~5 minutes to explain. The review of the previous exercise part C has fourteen (14) slides, and will take ~15 minutes to explain. The lecture material has thirty-six (36) slides, and will take ~45 minutes to explain. The introduction to this exercise has seven (7) slides, and will take ~5 minutes to explain.
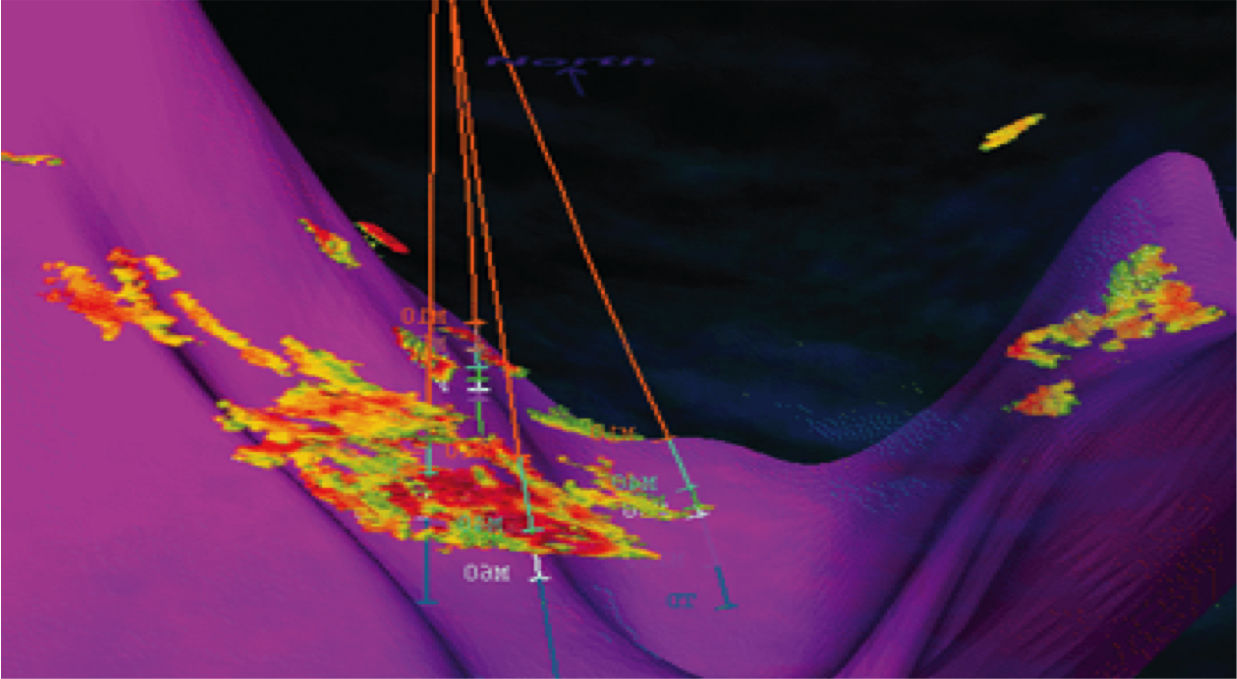
The exercise has the students analyze one (1) gather to get a slope-intercept pair. This is compared to well and seismic data to get a predicted fluid type at the gather location. This exercise is based on the Barracouta Field, but the data have been modified so that a thicker oil leg is predicted than was actually found. They are given nine (9) slope-intercept pairs in a table. They are to plot these data on a slope-intercept plot (the first data point is given). Based on their best fit straight line fit of these data pairs, they will determine the line’s slope and intercept. They plot their line’s slope versus intercept on Figure 4 and should discover that it falls within the oil “cloud.” Thus they would predict oil in the reservoir at the location of the gather. Figure 5 shows what the AVA prediction is for the top of the reservoir trough for gathers along the seismic line (red is gas, green is oil, and blue is brine/water). It is simple at this point to draw a gas:oil contact and an oil:water contact. We will assume these are flat on the TWT seismic section. This exercise should take about 15-20 minutes.
After this lesson, students should be able to:
This course, based on teaching material from Dr. Fred Schroeder (formerly of Exxon/ExxonMobil), reflects on the geology and geophysics basics for the petroleum industry. General geology and basic geophysics are not required, but helpful with the material.
We encourage the reuse and dissemination of the material on this site as long as attribution is retained. To this end the material on this site, unless otherwise noted, is offered under Creative Commons Attribution (CC BY 4.0) license