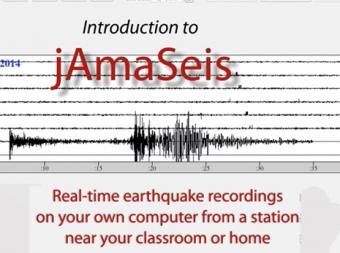
How can I monitor earthquakes on my own computer?
jAmaSeis is a java-based program that allows users to obtain and display seismic data in real-time from either a local seismometer, a remote educational seismometer connected to the jAmaseis network, or any research-quality seismometer that streams data to the IRIS Data Management Center. Users can also filter data, fit a seismogram to travel time curves, triangulate event epicenters on a globe, estimate event magnitudes, and generate images showing seismograms and corresponding calculations.
This video walks you through the steps to set it up on your computer and use it.
(The "Download All" button to the right downloads this video.)
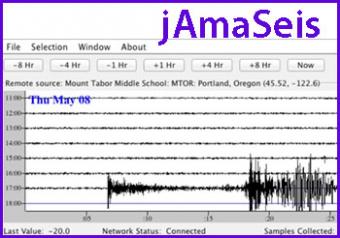
jAmaSeis is a free, java-based program that allows users to obtain and display seismic data in real-time from either a local instrument or from remote stations.
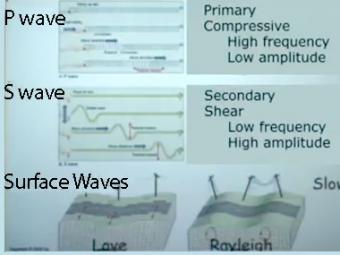
Video lecture on wave propagation and speeds of three fundamental kinds of seismic waves.
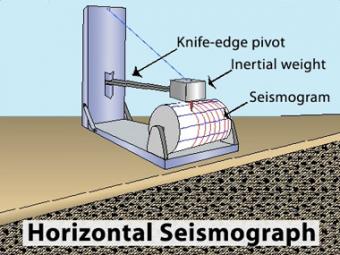
Animation of the principles of a drum-style horizontal seismograph station that records back- and-forth (N-S, E-W) movement.
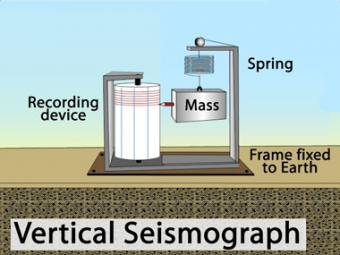
Animation of the principles of a drum-style vertical seismograph station that records up-and-down movement.
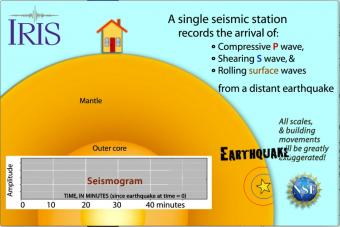
Seismic waves travel through the earth to a single seismic station. Scale and movement of the seismic station are greatly exaggerated to depict the relative motion recorded by the seismogram as P, S, and surface waves arrive.
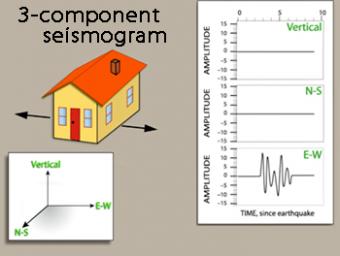
We use exaggerated motion of a building (seismic station) to show how the ground moves during an earthquake, and why it is important to measure seismic waves using 3 components: vertical, N-S, and E-W. Before showing an actual distant earthquake, we break down the three axes of movement to clarify the 3 seismograms.
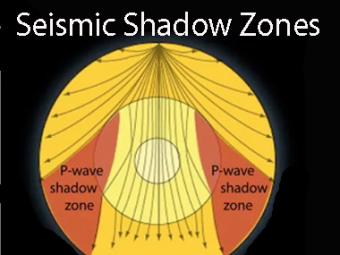
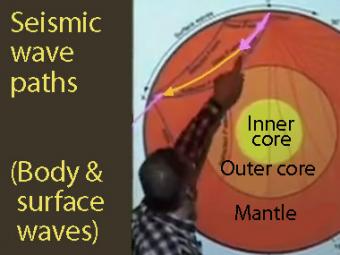
Seismic shadow zones have taught us much about the inside of the earth. This shows how P waves travel through solids and liquids, but S waves are stopped by the liquid outer core.
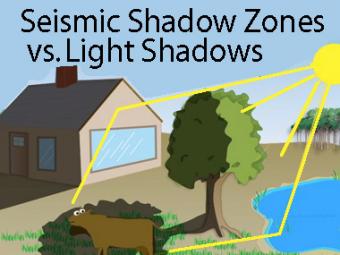
The wave properties of light are used as an analogy to help us understand seismic-wave behavior.
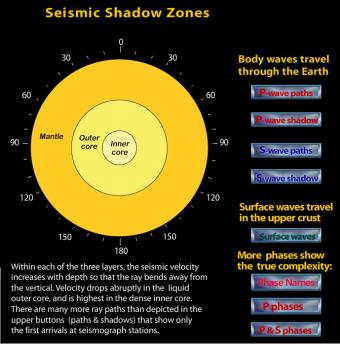
Roll over the buttons to see the difference between P- and S-wave seismic paths as well as their respective shadow zones.
We encourage the reuse and dissemination of the material on this site as long as attribution is retained. To this end the material on this site, unless otherwise noted, is offered under Creative Commons Attribution (CC BY 4.0) license