In this activity, students explore the relationship between an earthquake's magnitude and intensity. Students calculate the energy released during a weight drop (magnitude) and use an accelerometer (iPhone, QCN, or other) to investigate what happens to this energy as the source is moved further and further from the sensor (intensity). Students next examine USGS ShakeMaps to explore other factors besides an event's size and the distance from the source to the receiver that can effect the intensity (e.g. geologic structures, etc).
Students will be able to:
The "moment magnitude" scale has replaced the Richter scale for large earthquakes. Scientists have developed far-more sensitive seismometers that, with faster computers, have enabled them to record & interpret a broader spectrum of seismic signals than was possible in the 1930's, when the Richter magnitude was developed. Find out what scientists learn from seismograms.
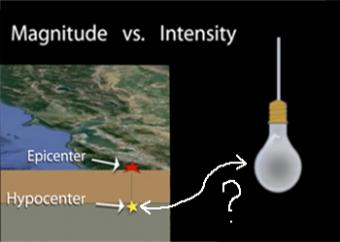
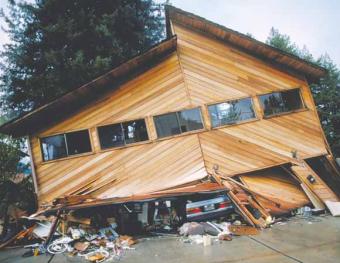
Magnitude and intensity are both related to the size of an earthquake, but they each measure different aspects. One is measured using seismometers; the others is felt. Let's use a lightbulb as an analogy.
Earthquake intensity (what is felt during an earthquake at any given location) is often mistaken for earthquake magnitude (the instrumentally measured size of that earthquake). This animation describes the main factors that contribute to differing intensities using examples of earthquakes. Produced in collaboration with the U.S. Geological Survey.
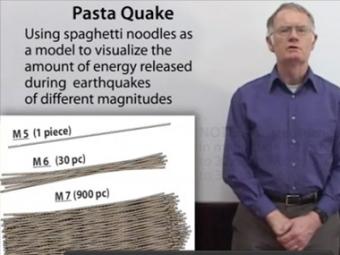
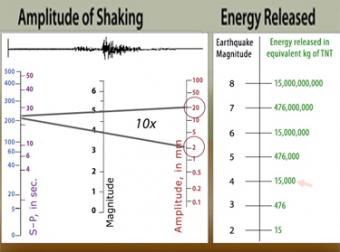
Understanding the magnitude change, thus the relative energy released from say, magnitude 7 to magnitude 8 can be challenging. Dr. Robert Butler (Univ. of Portland) uses spaghetti to illustrate the concept by breaking pasta to show how each step up in magnitude represents a huge jump in the size of the pasta bundles. Each step in magnitude is represented by 32 times more spaghetti noodles.
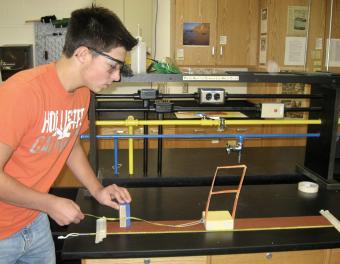
Using a block-and-sandpaper model, students collaborate in small groups to investigate how energy is stored elastically in rocks and released suddenly as an earthquake (the earthquake cycle). This activity emphasizes the role of mechanical models in understanding and testing ideas in science.
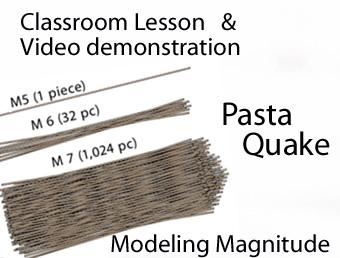
Learn about the earthquake magnitude scale and changes in the amount of energy released at each step by breaking different size bundles of uncooked spaghetti noodles! Students can both see and feel the differences in the energy released from a M4 - M8 quake.
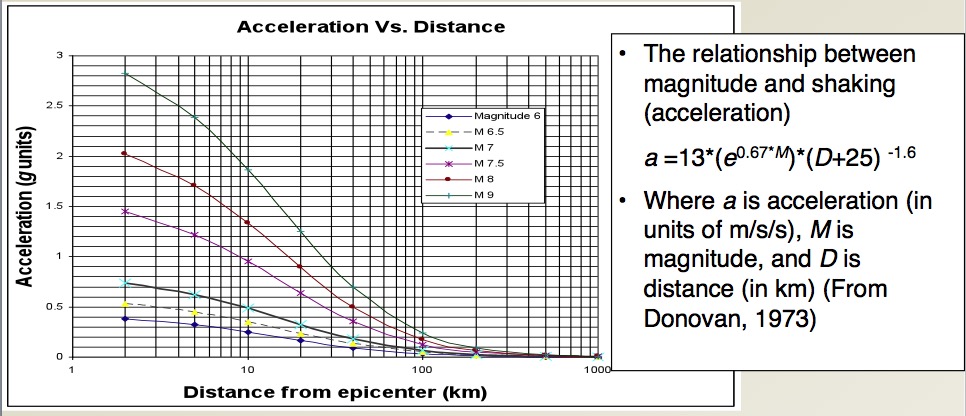
In this activity, students use a three-component accelerometer (iPhone, laptop or USB) to examine their assumptions about how 'hard" the ground shakes during an earthquake.
We encourage the reuse and dissemination of the material on this site as long as attribution is retained. To this end the material on this site, unless otherwise noted, is offered under Creative Commons Attribution (CC BY 4.0) license