SUMMARY
Controls the symbol plotting attributes.
SYNTAX
SYMBOL {ON|OFF|n} {SIZE v},{SPACING v},
   {INCREMENT {ON|OFF}},{LIST STANDARD|nlist}
INPUT
ON: Turn symbol plotting on. Don't change symbol number. OFF: Turn symbol plotting off. n: Turn symbol plotting on. Change symbol number to n. There are 16 different symbols. A symbol number of 0 is the same as turning symbol plotting off. SIZE v: Set symbol size to v. A value of 0.01 sets the size to 1 percent of the full plot size. SPACING v: Set symbol spacing to v. This is the minimum spacing between drawn symbols. Use 0 if you want a symbol at every data point. Use 0.2 to 0.4 for annotating lines. INCREMENT {ON}: Increment symbol number after each data file. The symbol number is the next one in the symbol list. INCREMENT OFF: Do not increment symbol number. LIST nlist: Change the content of the symbol list. Enter list of symbol numbers. Sets symbol number to first entry in list and turns symbol plotting on. LIST STANDARD: Change to the standard symbol list. Sets symbol number to first entry in list and turns symbol plotting on.
DEFAULT VALUES
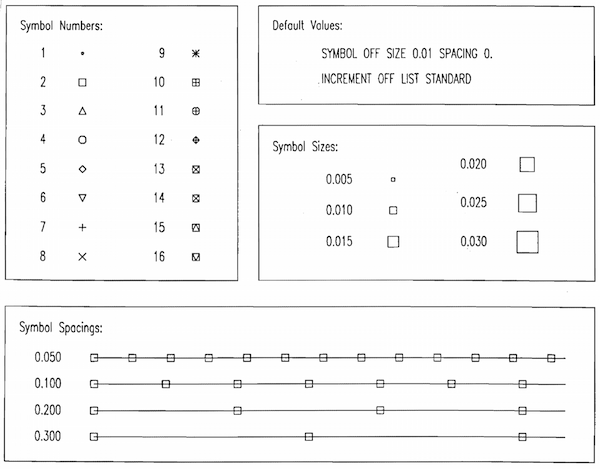
SYMBOL OFF SIZE 0.01 SPACING 0. INCREMENT OFF LIST STANDARD
DESCRIPTION
The figure that follows shows each of the sixteen symbols. Symbol 1 cannot be scaled in size. It is a replacement for the point symbol which does not show up well on many devices (e.g. Versatec, pen plotter). This figure also shows examples of different symbol size and spacing values. These symbol attributes are independent of the line drawing attributes defined by the LINE command. With line drawing on, they can be used to annotate different lines on the same plot. By turning the line drawing off, they can be used to create scatter plots.
If you are plotting several data files on the same plot, you may want each to be plotted with a different symbol. This is done using the INCREMENT option. When this option is on, the symbol is incremented from a list of symbols each time a data file is plotted. The default symbol list contains symbols 2 through 16. You may change the order or content of this list using the LIST option. This is useful if you are doing a series of overlay plots (see PLOT2) and want the same symbols used in the same order on each plot. A symbol number of 0 is the same as turning symbol plotting off. This is useful in the LIST option and the LINE command to display some data with lines and some with symbols on the same plot. See the example below.
EXAMPLES
To create a scatter plot, turn the line drawing off, choose an appropriate symbol, and plot:
SAC> LINE OFF
SAC> SYMBOL 5
SAC> PLOT
To annotate four solid lines on a PLOT2 plot using symbols 7, 4, 6, and 8, and a spacing of 0.3:
SAC> LINE SOLID
SAC> SYM SPACING .3 INCREMENT LIST 7 4 6 8
SAC> R FILE1 FILE2 FILE3 FILE4
SAC> PLOT2
To plot three files on the same plot using PLOT2 with the first file plotted using a solid line and no symbol, the second with no line and a triangle symbol, and the third with no line and a cross symbol:
SAC> READ FILE1 FILE2 FILE3
SAC> LINE LIST 1 0 0 INCREMENT
SAC> SYMBOL LIST 0 3 7 INCREMENT
SAC> PLOT2
SEE COMMANDS
LINE