SUMMARY
Controls the linestyle selection in plots.
SYNTAX
LINE {ON|OFF|SOLID|DOTTED|n} {FILL ON|OFF|{POS_COLOR|NEG_COLOR}}
     {INCREMENT {ON|OFF}}, {LIST STANDARD|nlist}
INPUT
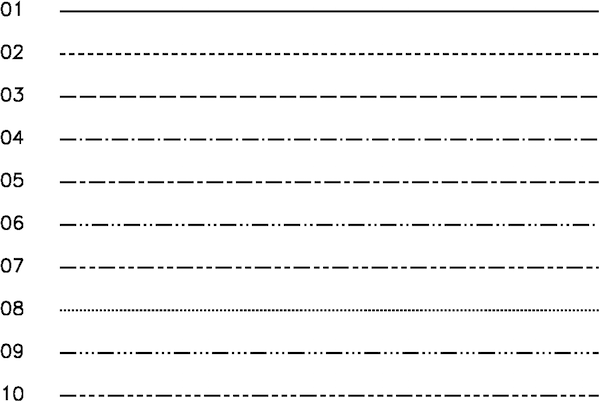
{ON}: Turn line-drawing on. Don't change linestyle. OFF: Turn line-drawing off. SOLID: Change to solid linestyle and turn line-drawing on. DOTTED: Change to dotted linestyle and turn line-drawing on. n: Change to linestyle n and turn line-drawing on. A linestyle of 0 is the same as turning turning line-drawing off. Figure below shows linestyles for n = 1 through 10. SOLID is n = 1, DOTTED is n = 8. INCREMENT {ON}: For multiple data files in a plot, increment linestyle from linestyle list for each data file in the plot. INCREMENT OFF: Do not increment linestyle for multiple data files. LIST STANDARD: Change to the standard linestyle list (1 2 3 ..). LIST nlist: Change the content of the linestyle list. Enter list of linestyle numbers (e.g., 3 1 2 ..). FILL ON/OFF: Turn filling on/off. FILL POS_COLOR/NEG_COLOR: Fill color for positive/negative section of the seismogram trace. Turns FILL on. See COLOR for color options. FILL LIST STANDARD: Use Standard color list for Color Filling. FILL LIST POS_COLOR/NEG_COLOR: Turn on color filling incrementing multiple colors in a list are available to set colors. Colors are specified in either Color Name or Number
DEFAULT VALUES
LINE SOLID INCREMENT OFF LIST STANDARD FILL OFF
DESCRIPTION
This command controls the linestyle used when plotting data. The skeleton (axes, titles, etc.) are always plotted using solid lines. Grid linestyle is controlled by the GRID command.
There are other commands that control other aspects of the data display. The SYMBOL command can be used to display a set of scalable, centered symbols at each data point. The COLOR command controls color selection, and the WIDTH command controls the line-width. All of these attributes are independent of each other. You may select a blue dotted line with a symbol at each data point if you desire. A linestyle of 0 is the same as turning line drawing off. This is useful in the LIST option and the SYMBOL command to display some data with lines and some with symbols on the same plot.
EXAMPLES
To select an incrementing linestyle using the STANDARD list - starting with linestyle 1:
SAC> LINE 1 INCREMENTTo change the linestyle list to contain linestyles 3, 5, and 1:
SAC> LINE LIST 3 5 1To plot three files on the same plot using PLOT2 with the first file plotted using a solid line and no symbol, the second with no line and a triangle symbol, and the third with no line and a cross symbol:
SAC>  READ FILE1 FILE2 FILE3
SAC>  LINE LIST 1 0 0 INCREMENT
SAC>  SYMBOL LIST 0 3 7 INCREMENT
SAC>  PLOT2
To fill in the positive ecursions on a seismogram with red and the negtive excursions with blue. If one leaves out the 0, the colored regions would be outlined with a black line:
SAC> fg seismo
SAC> line 0 fill red/blue
SAC> p1
LATEST REVISION
Version 102.0