SUMMARY
Computes the auto- and cross- correlation functions.
SYNTAX
CORRELATE  {MASTER name|n},
    {NUMBER n},{LENGTH ON|OFF|v},
    {TYPE  RECTANGLE|HAMMING|HANNING|COSINE|TRIANGLE}
INPUT
MASTER name|n: Select master file in data file list by name or number. All files will be correlated against this one. NUMBER n: Set number of correlation windows to be used. NORMALIZED OFF: No normalization NORMALIZED ON: Results are normalized between -1.0 and 1.0 LENGTH {ON}: Turn fixed window length option on. LENGTH OFF: Turn fixed window length option off. LENGTH v: Turn fixed window length option on and change window length in seconds to v. TYPE RECTANGLE: Apply a rectangle function to each window. This is equivalent to applying no function to each window. TYPE HAMMING: Apply a hamming function to each window. TYPE HANNING: Apply a hanning function to each window. TYPE COSINE: Apply a cosine function to each window. TYPE TRIANGLE: Apply a triangle function to each window.
DEFAULT VALUES
CORRELATE MASTER 1 NORMALIZED OFF NUMBER 1 LENGTH OFF TYPE RECTANGLE
DESCRIPTION
An auto-correlation is computed on the signal declared to be the master file, and a cross-correlation is calculated between the master file and each of the other signals in memory. This command computes correlations as defined by:
corr(tau) = int ( f(t) g(tau + t) ) dt,where f is the master file, g is any from among the signals in memory, and int means summation over all times t. The number of points in the master file cannot be greater than the number of points in any other file in memory.
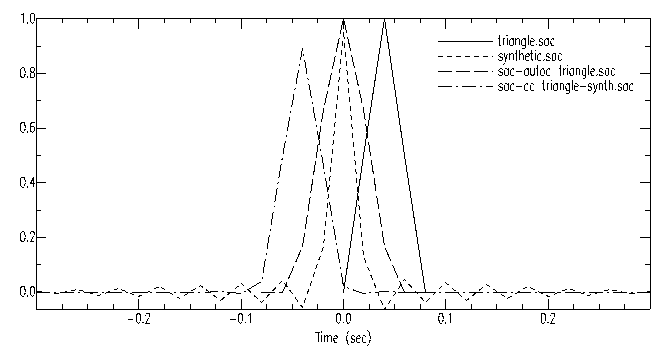
The input for SAC CORRELATE is files f and g. The output is the auto-correlation for f and the cross-correlation of f with g. The relative times for the two output files is most easily understood by examining the figure below. in this case, f is an isosceles triangle of duration 0.08 s starting at t = 0, which is produced by the commands:
SAC> fg triangle npts 9 begin -0.08 delta 0.02
SAC> cutim -0.04 0.04; ch b 0.0; write triangle.sac
In this example, g is a synthetic waveform with spikes at phase arrival times with amplitudes and polarity appropriate for that phase. The P arrival is at t = 0. The maximum amplitude for the auto-correlation always at output time tau = 0. The P arrival spike has a high correlation with the triangle pulse. Note that the maximum for the output cross-correlation is at around -0.04 s, the onset time for the triangle auto-correlation. The commands for CORRELATE for f with g in this case are as follows:
SAC> r triangle.sac synthetic.sac
SAC> correlate normalized
SAC> write sac-autoc_triangle.sac sac-cc_triangle-synth.sac
SAC> r sac-autoc_triangle.sac
SAC> ch kevnm "sac-autoc_triangle"
SAC> write over
SAC> r sac-cc_triangle-synth.sac
SAC> ch kevnm "sac-cc_tri-synth"
SAC> write over
After correlate normalized, the filenames and KEVNM remain as they were before. Shown here is an example as to to label the output files.
If N is the number of points in g and M the number of points in f, the total number of points in corr is N+M-1. SAC does the calculation in the frequency domain so if N is not a power of 2, it is increased to N2, the next power of 2. Both f and g are padded with zeroes to N2 points before the forward transforms. (It is wise to prepare all input files to minimize end effects.)
The windowing features of this command allow one to compute an average correlation function over a set of data windows. The number of windows is selectable and there are five standard windowing functions to choose from. When this windowing feature is on, a cross-correlation function is computed for each window. This collection of cross-correlation functions is then averaged, cut to the same length as the original data file, and replaces the data file in memory. You may also select the length of each window.
Window overlap is automatically calculated and used whenever the product of the requested window length (LENGTH option) and the number of windows (NUMBER option) exceeds the number of points in the data file (NPTS). By default, this windowing feature is off.
ADDITIONAL EXAMPLES
To calculate the correlation functions using the third file in memory as the master file:
SAC> CORRELATE MASTER 3You could also specify the master file by name if this is easier. Assume you have two data files that each contain 1000 points of noise. To compute the average correlation functions using 10 windows of 100 points each (i.e. no overlap) with a hanning function applied to each window:
SAC> CORRELATE TYPE HANNING NUMBER 10To achieve a twenty percent overlap of each window, set the window length to the equivalent of 120 data points. Assuming a sampling interval of 0.025 (40 samples per second) this would be three seconds as shown below:
SAC> CORRELATE TYPE HANNING NUMBER 10 LENGTH 3.0
HEADER CHANGES
DEPMIN, DEPMAX, DEPMEN, NPTS, B
ACKNOWLEDGEMENTS
This command is based on an algorithm developed by Dave Harris (DBH)
LATEST REVISION
SAC v102.0 (added normalization)